Abstract
Aim of this lecture
In this lecture we discusse how axonometric projections may be used in computer graphics, multimedia applications and computer games. We compare the axonometric projection or parallel perspective, to the linear perspective, lists the major properties and tackles some implementation details. Our focus is on the isometric and dimetric projections, the most widely used varieties of the axonometric projection.
Graphical projection
Definition
- perspective projection,
- parallel projection.
Perspective projection
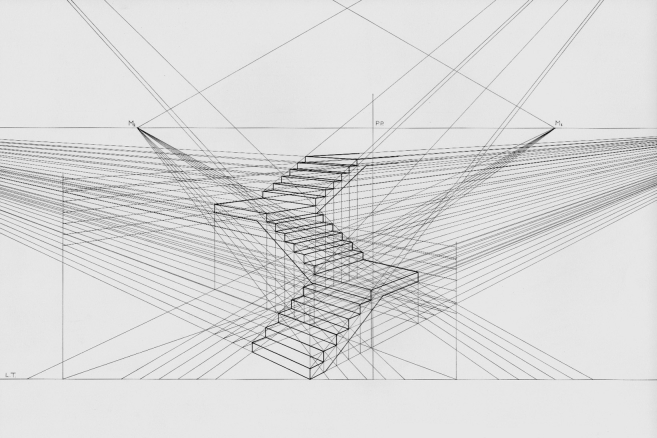
Perspective (from Latin perspicere, to see through (pl. przenikać wzrokiem; przyglądać się; badać)) in the graphic arts, such as drawing, is an approximate representation, on a flat surface (such as paper), of an image as it is seen by the eye.
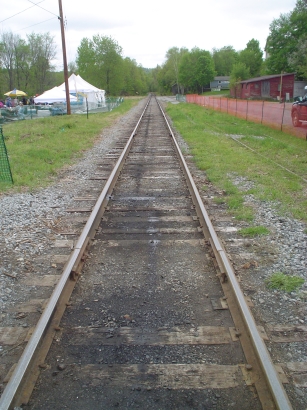
Perspective projection is a type of projection where three dimensional objects are not projected along parallel lines, but along lines emerging from a single point. This means that
- distant objects appear smaller than nearer objects;
- lines which are parallel in nature appear to intersect in the projected image.

Parallel projection
In the Western world, we are accustomed to the linear perspective but another perspective had developed in oriental art. The Chinese perspective was an intrinsic part of the classical scroll painting. A typical Chinese scroll painting had a size of approximately 40 centimetres high by several meters wide. One views the painting by unrolling it on a table in segments of about 60 centimetres wide. We can say, that the Chinese scroll paintings show a development in time -- a form of ,,narrative art'', in contrast to the paintings that were made in Europe at the time, which show a ,,situation'' rather than a development.

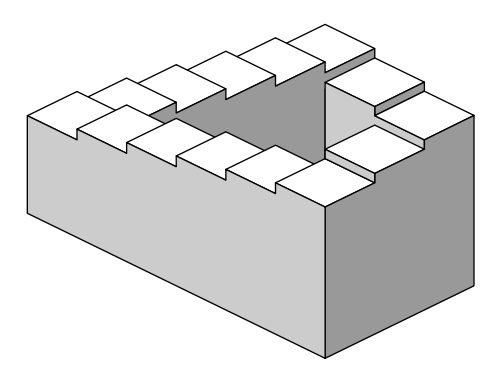
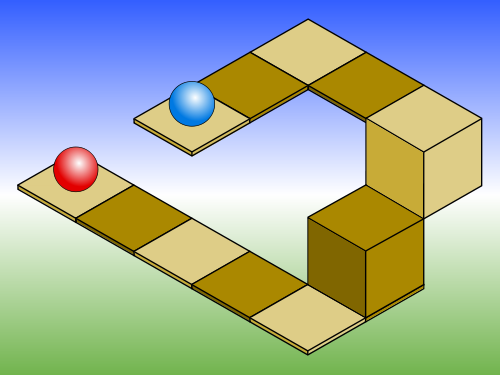
Problems with parallel projection
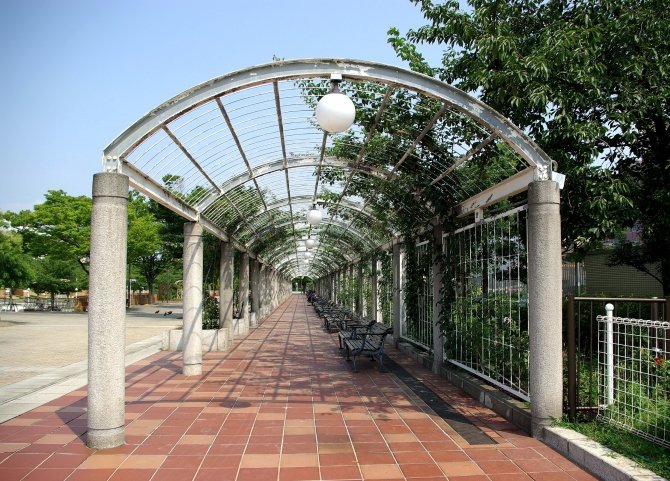
Objects drawn with parallel projection do not appear larger or smaller as they extend closer to or away from the viewer. While advantageous for technical drawings, where measurements must be taken directly from the image, the result is a perceived distortion, since unlike perspective projection, this is not how our eyes or photography normally work. It also can easily result in situations where depth and altitude are difficult to gauge, as is shown in the illustration to the bottom.
Axonometric projection
One of the most important type of parallel projection is an axonometric projection. Axonometric projection is a type of parallel projection used to create a pictorial drawing of an object, where the object is rotated along one or more of its axes relative to the plane of projection.
- Parallel projections have lines of projection that are parallel both in reality and in the projection plane.
- Axonometric projection is a type of parallel projection where the object is rotated along one or more of its axes relative to the plane of projection.
- Axonometric projection is a type of parallel projection where the plane or axis of the object depicted is not parallel to the projection plane, such that multiple sides of an object are visible in the same image.
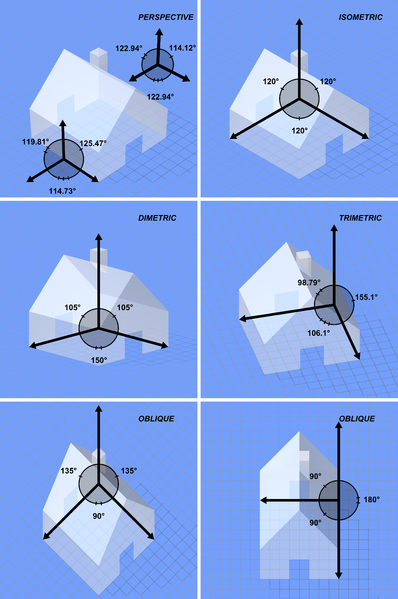
There are three main types of axonometric projection which is a type of parallel projection:
- isometric,
- dimetric,
- and trimetric projection,
Important property
A more important property of axonometry is its fixed relation between sizes of objects in world space and those on projected space, independent of the positions of the objects in projected space. In linear perspective, objects become smaller when they move farther away; not so in axonometric perspective. This means that we can measure the size of an object of a axonometric drawing and know how big the real object is (we need to know the scale of the drawing and the properties of the projection, but nothing else), something that cannot be done with linear perspective. This leads to the name of the projection: the word axonometry means measurable from the axes.
The main properties of axonometric projections are:
- No vanishing points. This allows to scroll a large image below a viewport and to have the same perspective at any point.
- Lines that are parallel in the 3-dimensional space remain parallel in the 2-dimensional picture. This is in contrast with the linear perspective, where parallel lines along the z-axis in the 3-dimensional space collapse to a single vanishing point at the horizon in the 2-dimensional picture.
- Objects that are distant have the same size as objects that are close; objects do not get smaller as they move away from the viewer. If we know the scale of the axes, we can measure the size (width, height, length, depth) of an object directly from the picture, regardless of its position on the z-axis; hence the name axonometry.
- The axonometric projections are standardized for technical drawings. These standards are optimized for ease of use versus visual realism.
Axonometric projection in practice
In practice (in computer graphics) axonometry, is a drawing technique where the orthogonal x-, y- and z-axes of the (3-dimensional) world space are projected to (non-orthogonal) axes on paper. In the projection, the y-axis usually remains the vertical axis, the z-axis is skewed and the x-axis may either be horizontal, as in the figure at the right, or be skewed as well.
Although there are countless possible axonometric projections, only two are standardized for technical drawings which are discussed in the following.When we want to use axonomertic projection two problems rises:
- What are common (or well-proportioned) axonometric projections, and how persuasive does each look?
- At what angles does one look at board in an axonometric projection? It is tempting to use rendered 3-D objects on an axonometric map, as sprites. To specify the position and orientation of the camera (view point) in relation to the object, we will need to know the intrinsic angles of the axonometric map that we are using.
The isometric projection
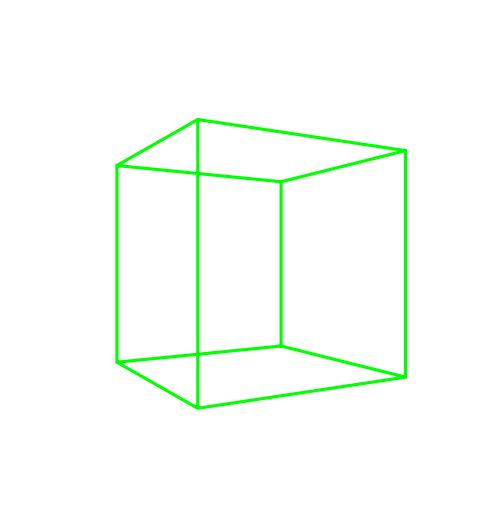
As we know from the previous part, the isometric projection is a type of axonometric projection which is in turn a type of parallel projection. The term isometric comes from the Greek for equal measure (gr. isos -- equal), reflecting that the scale along each axis of the projection is the same (unlike some other forms of graphical projection). It means that in an isometric projection, the x-, y- and z-axes have the same metric: a unit along the x-axis is equally long along the y- and z-axes. In other words, if we render a wire frame cube, all edges in the 2-dimensional picture are equally long. Another property of the isometric projection is that the projected wire frame cube is also symmetric. All sides of the projected cube are rhombuses.
Isometric projection as a standard
The international standard ISO 5456-3 (Technical drawings -- Projection methods -- Part 3: Axonometric representations; PN-EN ISO 5456-3:2002 Rysunek techniczny -- Metody rzutowania -- Część 3: Przedstawianie aksonometryczne) describes an isometric projection that is symmetric with regards to the vertical axis; the angle between the x- and y-axes, and between the z- and y-axes, is 60 degrees. The projection shows three sides of a cube, and the surfaces of each side are equal. The 30 angle between the x- and z-axes and the ,,horizon'' is convenient for technical drawings, because the sine of 30 is $\frac{1}{2}$.
Isometric projection in computer games
Computer games with isometric maps are often tile-based. To make tiles match, the game designer must take into account how diagonal lines are plotted in discrete steps. As it turns out, a line at 30 degrees (sine is 0.5) produces steps that are too irregular. A line at an angle where the tangent is 0.5 does have a nice regular pattern: two steps to the right, one step up. Thus, the isometric projection used by most games tilt the x- and z-axes with approximately 27 degrees (the exact angle is $\arctan(0.5)$). Because the tangent of the angle of the rhombus is 0.5, the rhombus is twice as wide as it is high. This is why many sources mention a 1:2 scale for isometric perspectives.
Isometric projection in military
The two isometric projections mentioned above ,,skew'' all faces of the example cube. In applications where the most important faces are the horizontal ones, for example in applications where maps or floor plans are paramount, another isometric projection is common. It is called the ,,military'' projection, probably because of its origin or use. In the military projection, the angles of the x- and z-axes are at 45, meaning that the angle between the x-axis and the z-axis is 90. That is, the x-z plane is not skewed. It is rotated over 45, though.
The dimetric projection
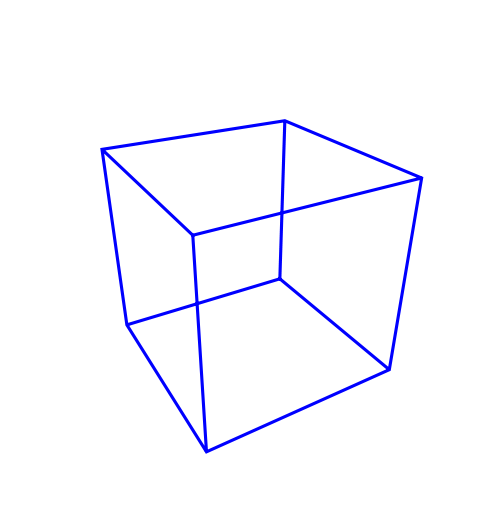
In the dimetric projection, one of the three axes has a different scale than the other two. In practice, the scaled axis is the z-axis and, hence, a cube drawn in a dimetric projection is not a symmetrical graphic (like in the isometric projection).
Dimetric projection in computer games
As was the case with the isometric projection, in computer graphics some angles are preferable to others. The first dimetric projection we can use for (tiled) computer graphics is very similar to the projection of Chinese scroll paintings. The difference is the scale of the z-axis, and the angle that it makes with the x-axis. To start with the angle, the z-axis is slanted with approximately 27 degrees (the exact angle is $\arctan(0.5)$). This is the same angle as the isometric projection for computer graphics uses. The scale is such that the width of the side view of a cube, when measured along the x-axis, is half of the width of the front face. The key phrase in the previous sentence is ,,when measured along the x-axis''. In the two former projections, the scale factor applied to distances measured along the z-axis.
Dimetric projection in platform games
The above projection gives a perspective that is viewed mostly from the side. I might be useful to add some depth to a side-scrolling (or ,,platform'') game. For board-like games, a perspective that is viewed from a greater height is more appropriate. The second proposed dimetric projection for games serves this end. Again, note that the perspective of the two projections suggested above is distorted. The angles in the top and side views are really approximate. For example, in the second projection the angle at which one looks from above at the scene is given as 24 degrees. However, using an angle of 30 degrees may actually look better. In addition, a 30-degree angle lets us use the same objects for both the dimetric and the isometric projections for games.
Conversion from 3D to 2D
Converting from space coordinates (x,y,z) to a pixel coordinate (x',y') in the projection requires only trivial geometry (we consider left-handed orientation).Isometric
\[ \begin{array}{rcl} x' & = & (x-z)\cos (30)\\ y' & = & y + (x+z)\sin (30) \end{array} \]
Isometric (computer games)
\[ \begin{array}{rcl} x' & = & (x-z)\\ y' & = & y + \frac{x+z}{2} \end{array} \]
Dimetric (ISO)
\[ \begin{array}{rcl} x' & = & x\cos (7)+\frac{z \cos (42)}{2}\\ y' & = & y + \frac{z \sin (42)}{2} - x \sin(7) \end{array} \]
Dimetric (computer games: side view)
\[ \begin{array}{rcl} x' & = & x + \frac{z}{2}\\ y' & = & y + \frac{z}{4} \end{array} \]
Dimetric (computer games: top view)
\[ \begin{array}{rcl} x' & = & x + \frac{z}{4}\\ y' & = & y + \frac{z}{2} \end{array} \]
Isometric and hexagonal maps
Tile Maps
A tile-based game is a game that uses tiles as one of the fundamental elements of play. Traditional tile-based games use small tiles as playing pieces for gambling or entertainment games.
Three types of tiles
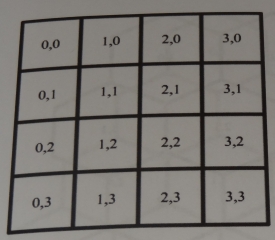
- Square. A tile-based game often uses square ar rectangular sections of the screen to represent the individual tile. Typically, whatever occupies the tile is contained wholly within it and does not extend beyond the borders of the square are rectangle. This makes rendering portions of rectangular maps really easy, as you can redraw a portion of the map without worrying too much about the other portions.
- Rhombus. Unlike rectangular maps, the tiles in an isometric grid almost always have a graphic that exceeds the boundaries of the tile. This makes the rendering order of the tiles important.
- Hexagon. A tile-based game that uses a hexagonal map consists of hexagons. Like rectangular maps, the tiles in a hex grid usually entirely contain the objects within them, so rendering updates is pretty simple but still not as trivial as rectangular maps.
Isometric and hexagonal maps. How maps are constructed -- square case
In a rectangular map, life is easy.
Isometric and hexagonal maps. How maps are constructed -- rhombus (isometric) case
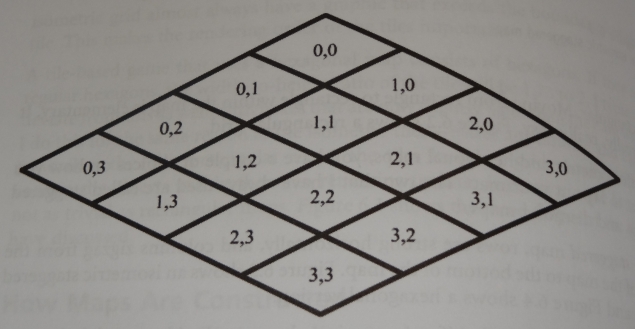
In this case we have a choice between staggered map and diamond map.
- In a staggered map, rows are strung horizontally, and columns zigzag from the top of the map to the bottom of the map.
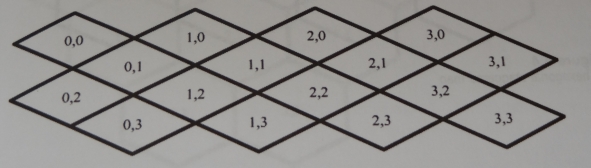
- In a diamond map, rows and columns go on a diagonal.
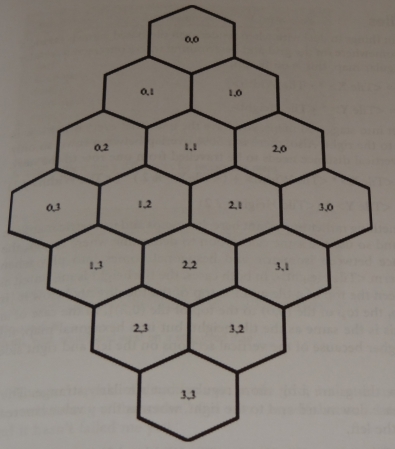
Isometric and hexagonal maps. How maps are constructed -- hexagon case
In this case, like for rhombus case, we have a choice between staggered map and diamond map.
- In a staggered map, rows are strung horizontally, and columns zigzag from the top of the map to the bottom of the map.
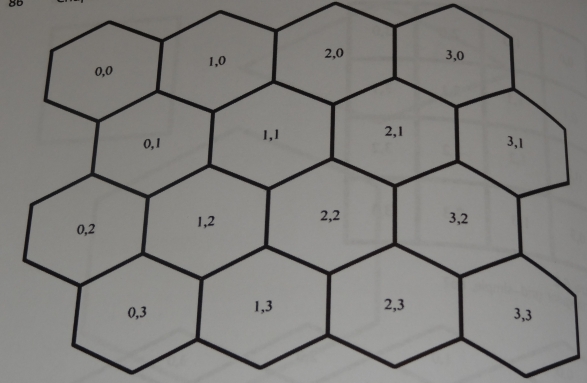
- In a diamond map, rows and columns go on a diagonal.