In this tutorial we cover the following topics
I assume we have Wireshark installed on our system. It's not complicated process so I will skip this part.
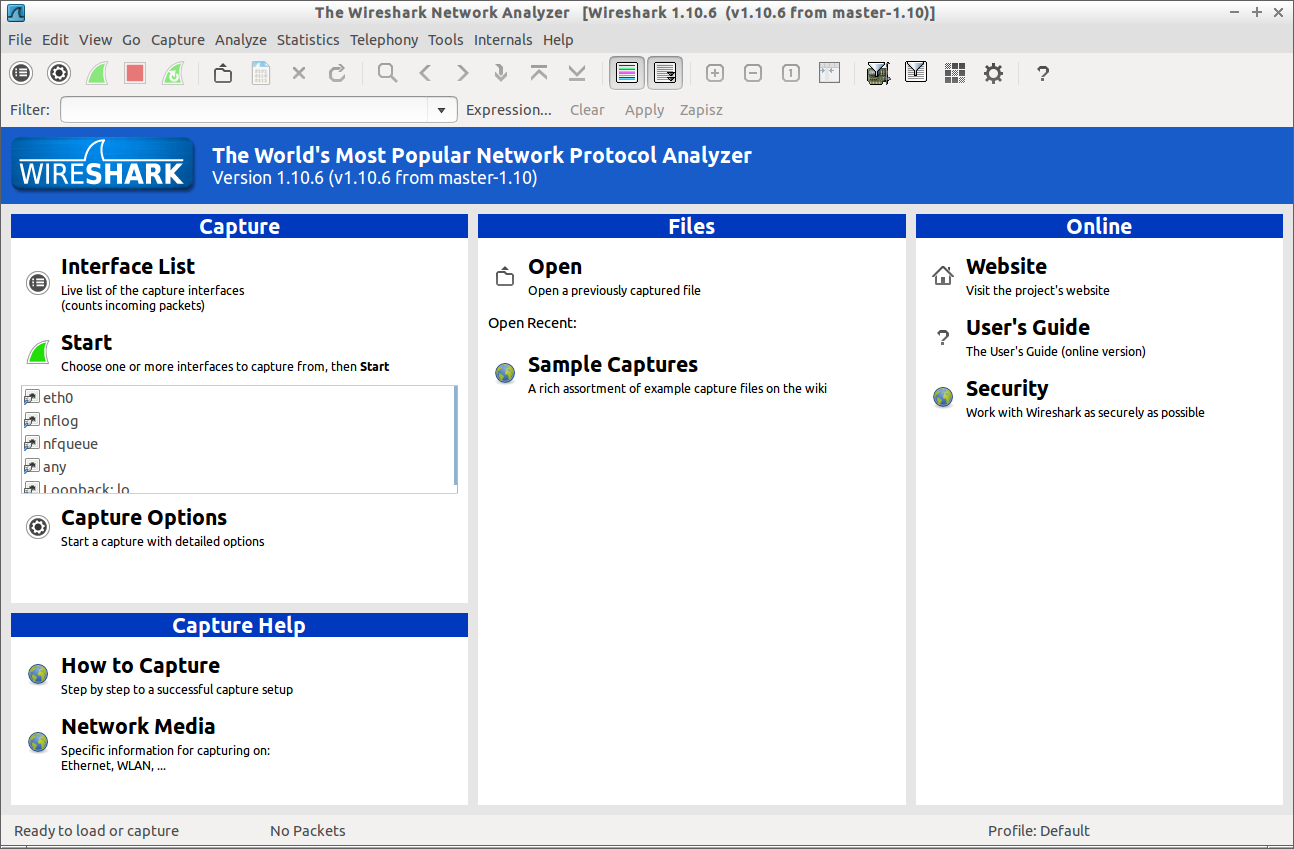
When we start the software

|
we will see screen similar to the following with two main options on it
|
- Start right now the capture process on selected interface, or
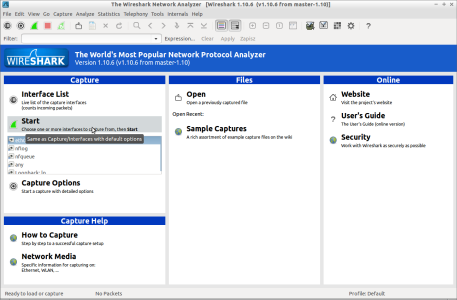
- start after some capture options selection


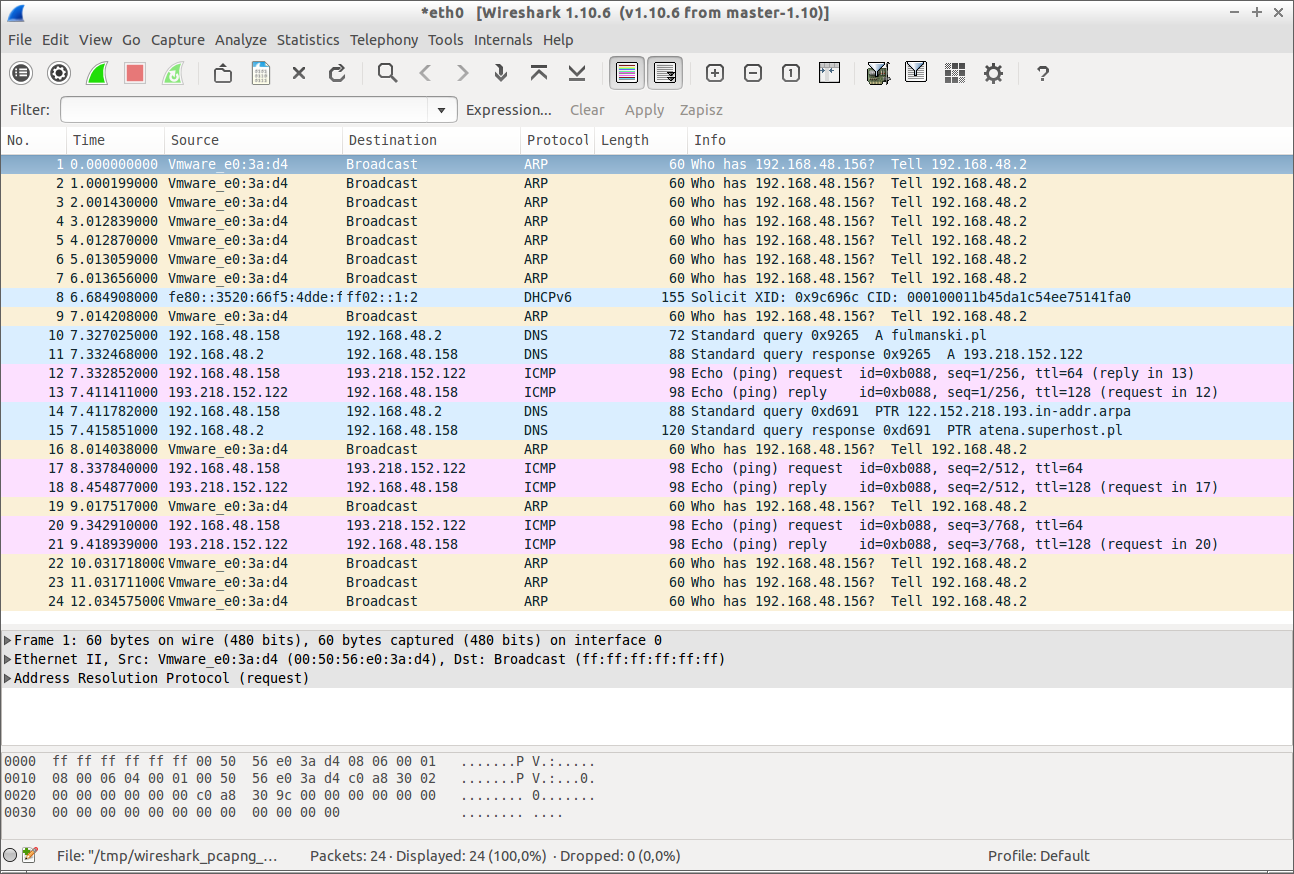
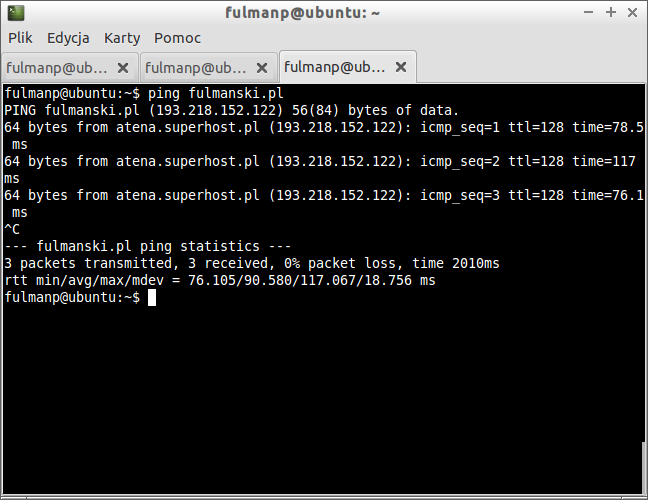
Whatever option we select, main screen should be displayed with more or less informations displayed on it. In my case there was less information so I stimulated my network with ping message
|
1 2 3 4 5 6 7 8 9 10 |
fulmanp@ubuntu:~$ ping fulmanski.pl PING fulmanski.pl (193.218.152.122) 56(84) bytes of data. 64 bytes from atena.superhost.pl (193.218.152.122): icmp_seq=1 ttl=128 time=78.5 ms 64 bytes from atena.superhost.pl (193.218.152.122): icmp_seq=2 ttl=128 time=117 ms 64 bytes from atena.superhost.pl (193.218.152.122): icmp_seq=3 ttl=128 time=76.1 ms ^C --- fulmanski.pl ping statistics --- 3 packets transmitted, 3 received, 0% packet loss, time 2010ms rtt min/avg/max/mdev = 76.105/90.580/117.067/18.756 ms fulmanp@ubuntu:~$ |
|
|
Then I stopped capturing with Captur | Stop option (captured package). Now it's time to take a short tour on most important options and features of Wireshark.
At a glance, Wireshark's interface is divided into following parts (depending on version and platform there can be more sections or location can be different but listed below are the most basic and should be always (somewhere) presen; in case on any problems refer to official documentation Wireshark User’s Guide and Chapter 3. User Interface)
- Menu Depending on version and platform we can find there, among oters, options like
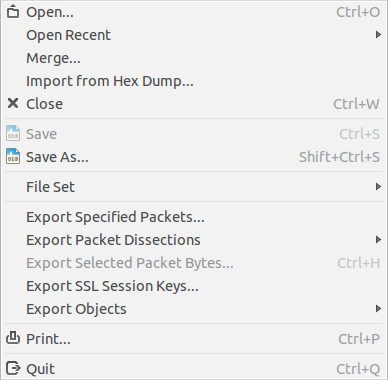
- File
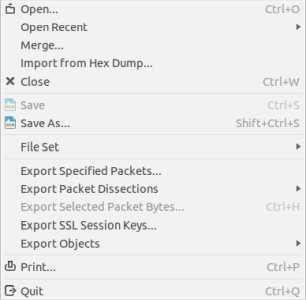
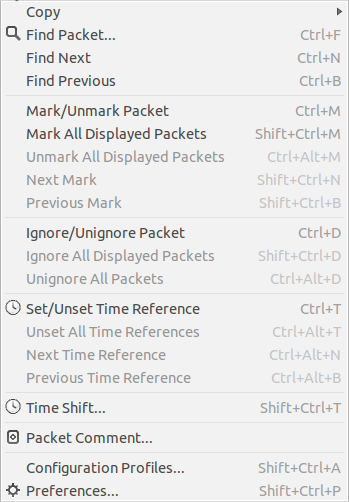
Here we can open, save our captured data in few different ways. - Edit
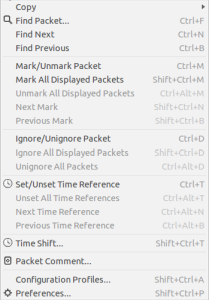
Here we can finds or mark packets, set general preferences as well as set time references. - View

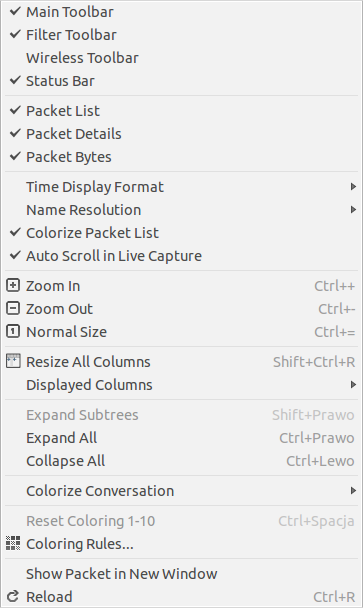
Here we can configure the Wireshark platform view. There can be also set time display format (Time Display Format) and name resolution policy (Name Resolution). - Go

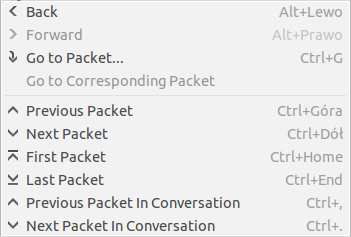
Here we can move over our captured data. - Capture
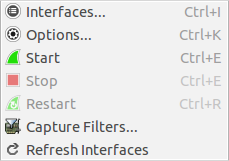
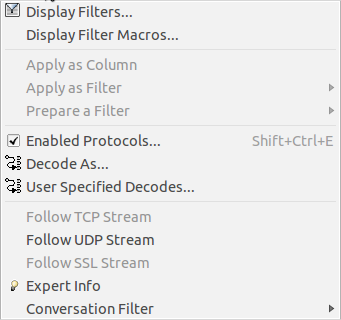
Here we can select the interface(s) beeing captured, set capture filters options, start and stop the capture. - Analyze

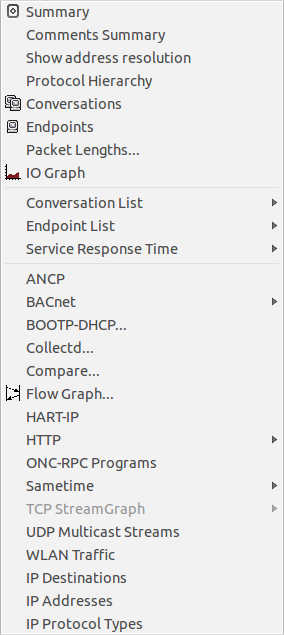
Here we can set analyze options. - Statistics

Here we can find many differnt statistics and summary which could be helpful analyzing big network traffic. - Help
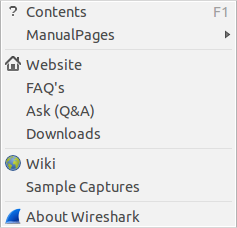
Here we can find typical information we can find in every help menu. The only noteworthy option is Sample Captures which redirect us tohttps://wiki.wireshark.org/SampleCapturespage where we can find a lot of sample captures in case we would be unable to get some type of captures in our network. - Tools

Here we can find some auxilary tools, for example Lua. Lua options allow us to work with the Lua interpreter optionally build into Wireshark. Lua can be used to write dissectors, post-dissectors and taps.
- File
- Toolbar Below the menu there are shortcuts icons.
- Display filter The display filter is used to search inside the captured logs. Please note that display filter and capture filter are different things. Both filters are described in the following part of this tutorial.
- Packet list pane The packet list pane displays all the captured packets after applying to them display filters.
- Packet details pane The packet details pane gives in depth information about a packet selected in the packet list pane. The information is displayed per OSI layer and can be expanded and collapsed. Every bit of packet is explained so there is no need of doing this manually.
- Packet Disscestion (Packet bytes pane) The dissector panel also called packet bytes pane, displays the same information as those provided on the packet details pane but in the raw form as the hexadecimal number without interpretation other than ascii codes. With this only ascii strings are visible and human readable.
- Status bar Just a status bar with some statistic and general information.


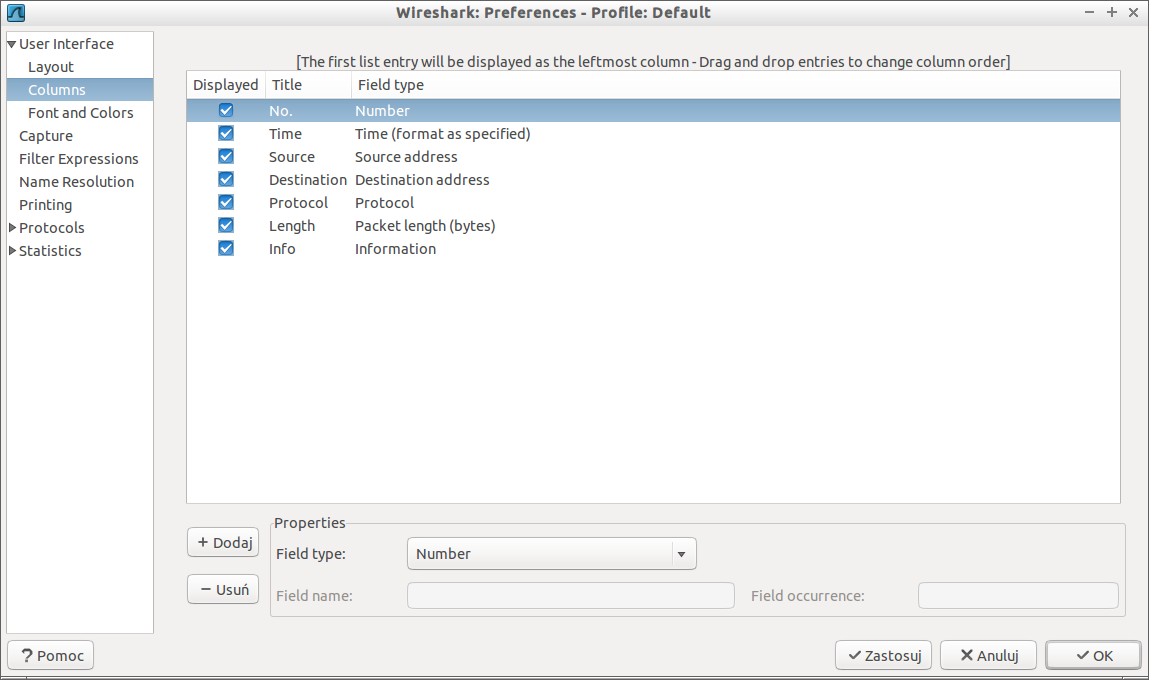
Select Edit | Preferences and then from left option tree User Interface | Columns
|
In this dialog window we can adjust column type and order we want to see in packet list pane.
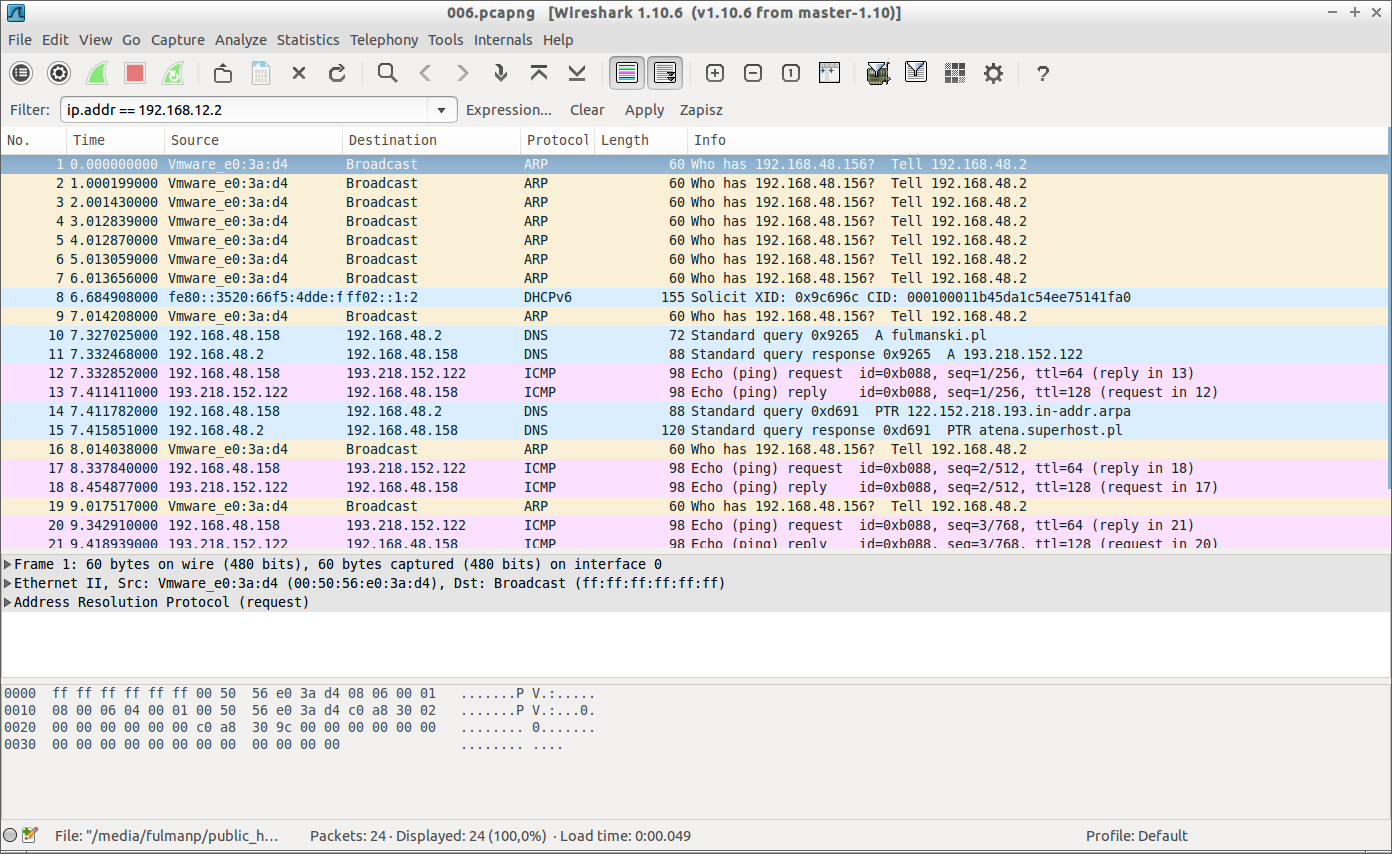
Select View | Time Display Format where we can choose one of many time measure methods, for example compare Seconds Since Beginning of Capture
|
with Seconds Since Previous Captured Packet

|
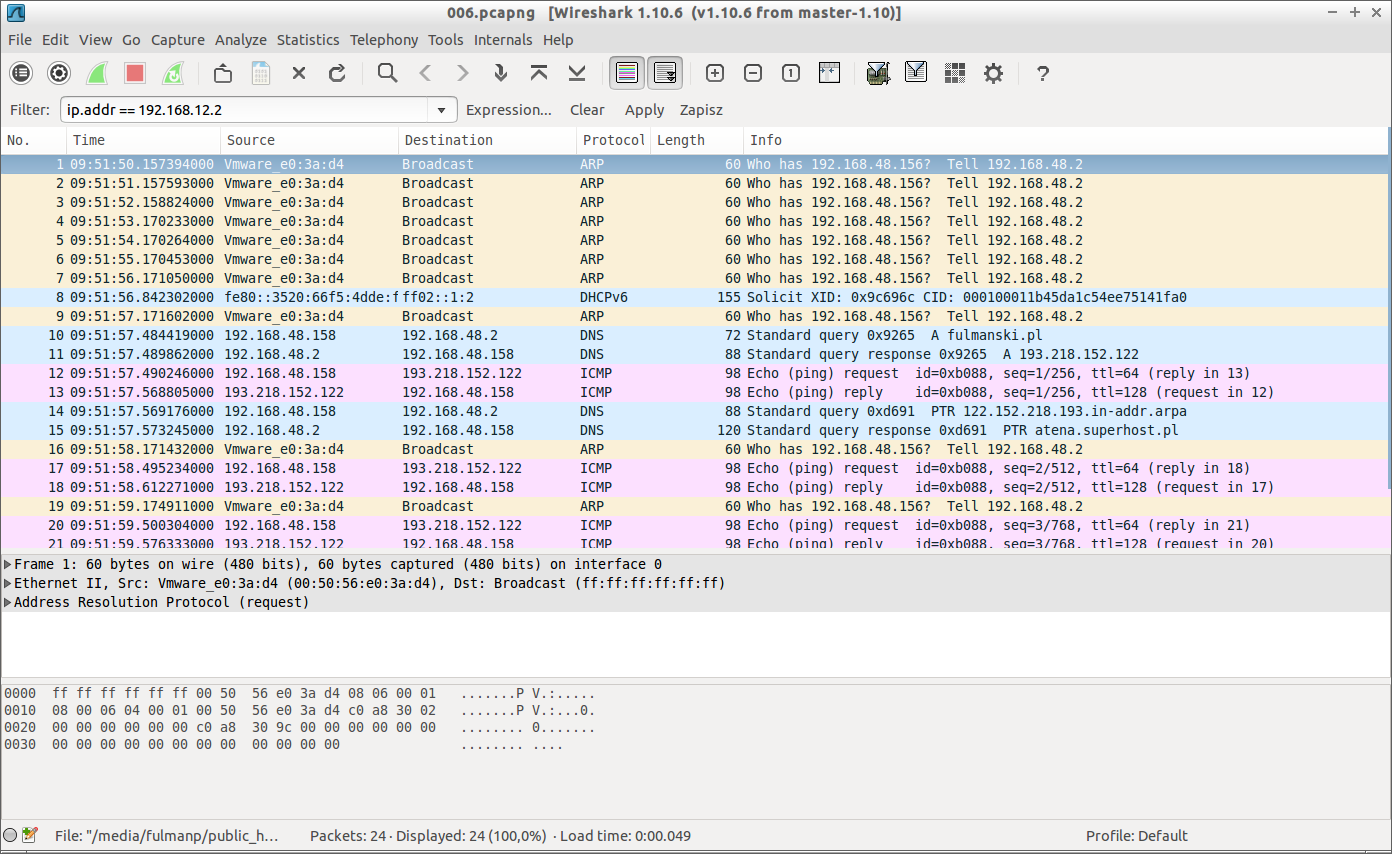
with UTC Time of Day
|
Select View | Name Resolution

|
to turn on or off name resolution. For example compare state without any name resolution

|
with Enable for MAC Layer

|
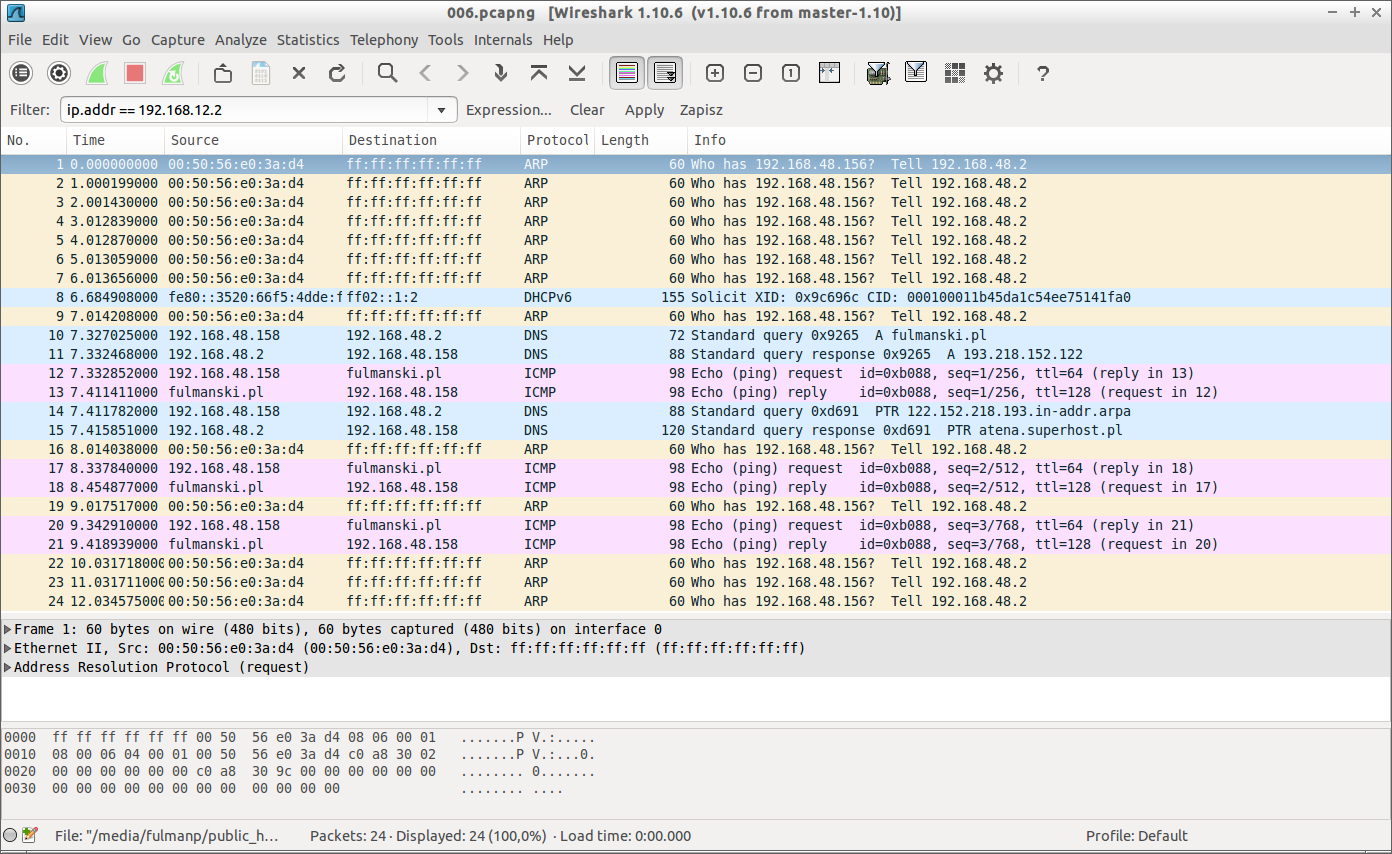
with Enable for Network Layer
|
When we launch Wireshark in reach network environment we will be flooded with information unless settings are different then default. Remember to keep things simple and do no more than you have. Too much information hides the important information. This is the place and time when filter are handy -- they will help us to target, in the prolific logs, the data we are looking for.
There are two kinds of filters:
- Capture filters: Used to select the data to record in the logs. They are defined before starting the capture. There is no method to get information filtered out by this filters. Simply speaking, capture filters select the data to be saved and irrevocably throws other away. The capture filter is used as a first large filter to limit the size of captured data to avoid generating a log too big.
- Display filters: Used to search inside the captured logs. They can be modified while data is captured. Simply speaking, display filters narrow packet set from what has been recorded to what interests us now. If we change our mind, we can always change the filters set to select other set of packages (but remember that we can't this way select packages rejected by first type of filters - the capture filters). The display filter (which is much more powerful and complex) will permit to search exactly the data we want.
General syntax of the capture filter syntax is given below (for more details please follow official Filtering while capturing and CaptureFilters).
A capture filter takes the form of a series of primitive expressions connected by conjunctions (and/or) and optionally preceded by not:
|
1 |
[not] PRIMITIVE [and|or [not] PRIMITIVE ...] |
A primitive is simply one of the following:
|
1 2 3 4 5 6 7 8 9 |
[src|dst] host HOST ether [src|dst] host EHOST gateway host HOST [src|dst] net NET [{mask MASK}|{len LEN}] [tcp|udp] [src|dst] port PORT less|greater LENGTH ip|ether proto PROTOCOL ether|ip broadcast|multicast EXPR relop EXPR |
Because one piece of code is worth more than million words let's see some of them
-
host 172.18.5.4
Capture only traffic to or from IP address 172.18.5.4. -
net 192.168.0.0/24
or
net 192.168.0.0 mask 255.255.255.0
Capture traffic to or from a range of IP addresses. -
port 53
Capture only port 53 traffic. -
host www.example.com and not (port 80 or port 25)
Capture non-HTTP and non-SMTP traffic on your server. -
port not 53 and not arp
Capture except all ARP and DNS traffic. -
(tcp[0:2] > 1500 and tcp[0:2] < 1550) or (tcp[2:2] > 1500 and tcp[2:2] < 1550)
or
tcp portrange 1501-1549
Capture traffic within a range of ports. Recall TCP header of the form
12345678910111213141516171 1 1 1 1 1 1 1 1 1 2 2 2 2 2 2 2 2 2 2 2 30 1 2 3 4 5 6 7 8 9 0 1 2 3 4 5 6 7 8 9 0 1 2 3 4 5 6 7 8 9 0 1+-+-+-+-+-+-+-+-+-+-+-+-+-+-+-+-+-+-+-+-+-+-+-+-+-+-+-+-+-+-+-+-+| SOURCE PORT | DEST PORT |+-+-+-+-+-+-+-+-+-+-+-+-+-+-+-+-+-+-+-+-+-+-+-+-+-+-+-+-+-+-+-+-+| SEQUENCE NUMBER |+-+-+-+-+-+-+-+-+-+-+-+-+-+-+-+-+-+-+-+-+-+-+-+-+-+-+-+-+-+-+-+-+| ACKNOWLEDGMENT NUMBER |+-+-+-+-+-+-+-+-+-+-+-+-+-+-+-+-+-+-+-+-+-+-+-+-+-+-+-+-+-+-+-+-+| DO | R | ECN | CB | WINDOW |+-+-+-+-+-+-+-+-+-+-+-+-+-+-+-+-+-+-+-+-+-+-+-+-+-+-+-+-+-+-+-+-+| CHECKSUM | UP |+-+-+-+-+-+-+-+-+-+-+-+-+-+-+-+-+-+-+-+-+-+-+-+-+-+-+-+-+-+-+-+-+| OPTIONS ... AND PADDING |+-+-+-+-+-+-+-+-+-+-+-+-+-+-+-+-+-+-+-+-+-+-+-+-+-+-+-+-+-+-+-+-+| DATA |+-+-+-+-+-+-+-+-+-+-+-+-+-+-+-+-+-+-+-+-+-+-+-+-+-+-+-+-+-+-+-+-+
and note that in expresion[ expr : size ]firs term (expr) is the byte offset, relative to the indicated protocol layer while second (size) is optional and indicates the number of bytes in the field of interest (it can be either one, two, or four, and defaults to one). -
(src host 10.4.1.12 or src net 10.6.0.0/16) and tcp dst portrange 200-10000 and dst net 10.0.0.0/8
Capture traffic with source IP address 10.4.1.12 or source network 10.6.0.0/16 such that destination TCP portrange is from 200 to 10000 and destination IP network is 10.0.0.0/8. -
gateway yogi and ip[2:2] > 576
Capture IP packets longer than 576 bytes sent through gateway yogi.
Wireshark provides a simple but powerful display filter language that allows us to build quite complex filter expressions. Again let's look into series of examples (for more details please follow official Building display filter expressions and DisplayFilters)
-
ip.addr == 10.1.1.1
Displays the packets with source or destination IP address equals to 10.1.1.1. -
tcp.port == 25
Display packets with TCP source or destination port 25 (by default on port 25 an SMTP is located). -
tcp.dstport == 25
Display packets with TCP destination port 25. -
tcp.flags.syn == 0x02
Display packets with a TCP SYN flag. -
tcp.port eq 25 or icmp
Show only SMTP and ICMP traffic. -
dns || icmp
Display the DNS or ICMP traffics. -
udp contains 81:60:03
Match packets that contains the 3-byte sequence 0x81, 0x60, 0x03 anywhere in the UDP header or payload. -
udp[8:3]==81:60:03
Match packets containing the (arbitrary) 3-byte sequence 0x81, 0x60, 0x03 at the beginning of the UDP payload, skipping the 8-byte UDP header. Note that the values for the byte sequence implicitly are in hexadecimal only. -
tcp.port == 80 || tcp.port == 443 || tcp.port == 8080
or simply
tcp.port in {80 443 8080}
Display packets with TCP source or destination port 80 or 443 or 8080.
Next to display filters text field there is a button Expression

|
which lanches window with protocols and fields we can use to create (sub)expressions

|

|
Select Statistics | Endpoints
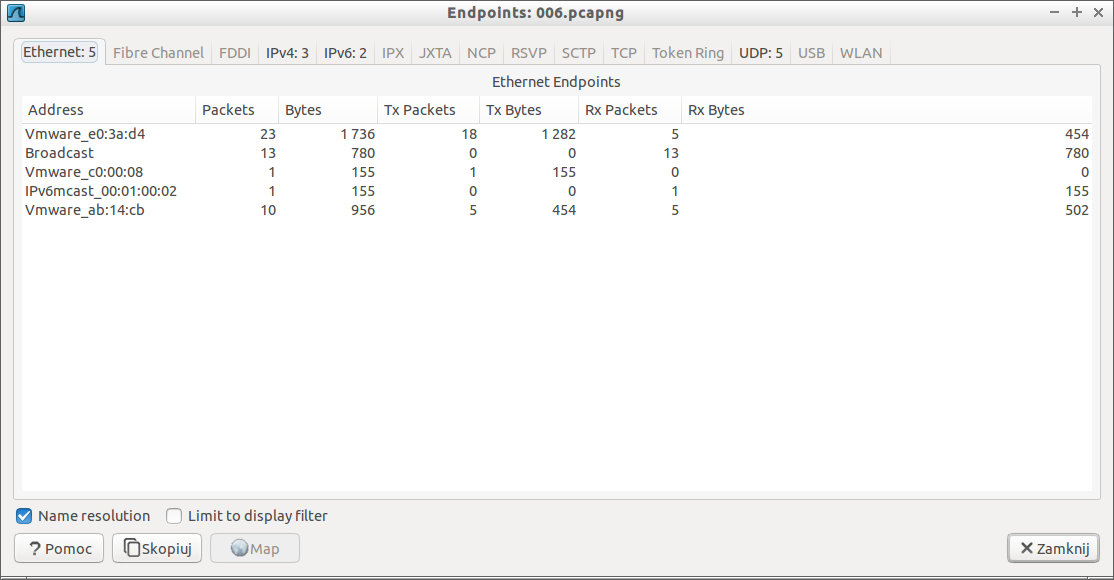
|
Select Analyze | Display Filters...
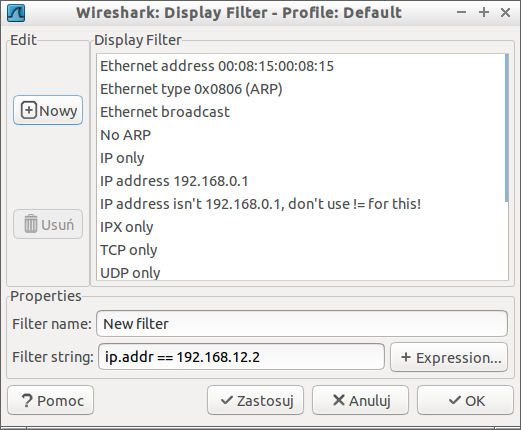
|
Here we can select on from predefined display filter or create our own in case we use it frequently.
- Step 1: Start your favourite server side environment with PHP enabled (for example XAMPP, WAMP or simply use unix like system with Apache and PHP installed).
- Step 2: Prepare the following file and put them in your web directory. In my case directory is
/var/www/fulmanp/public_html/test/t- File 1:
- File 2:
- File 1:
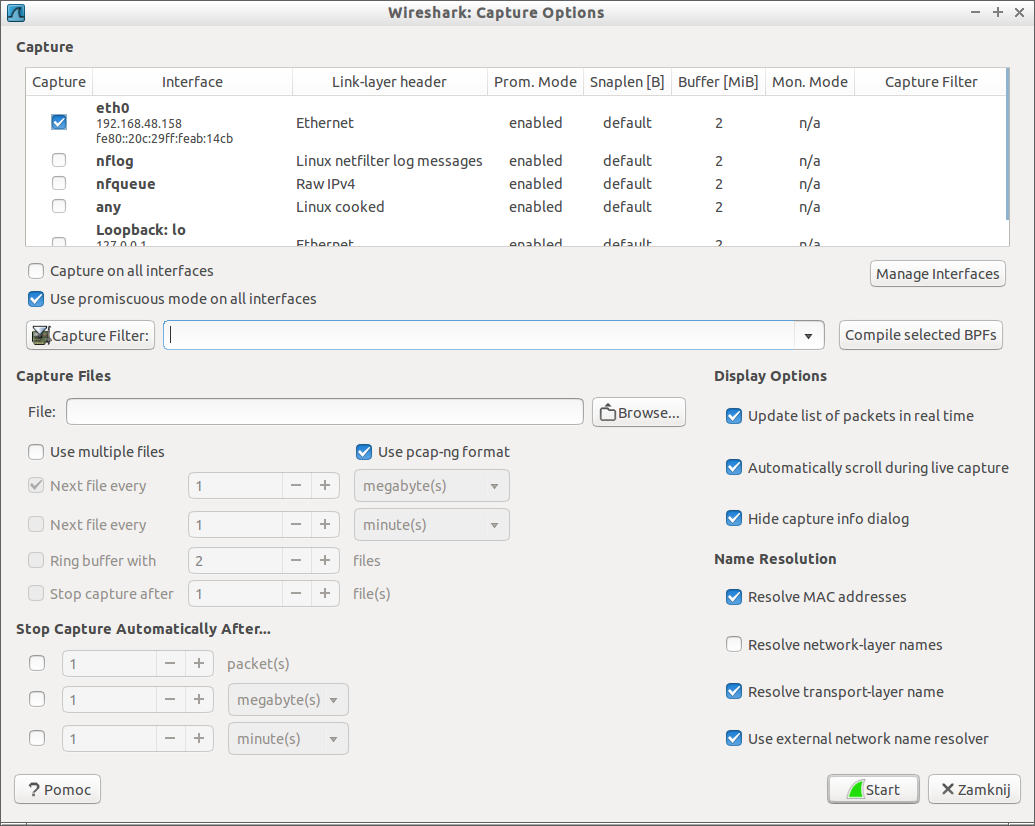
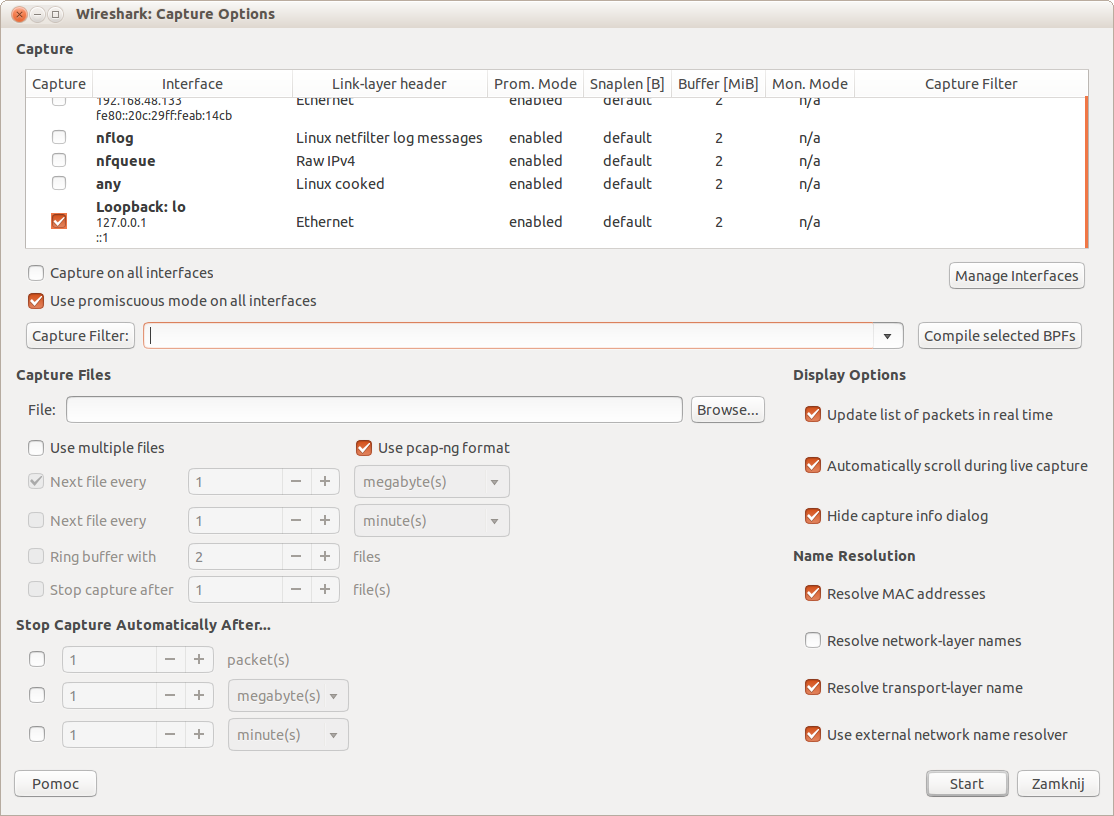
- Step 3: Start Wireshark and in Capture Options select
- Interface: loopback if you use your local computer as a server and client or other interface if you use remote server.
- Check Use promiscuous mode on all interfaces -- with this we will capture all the traffic not only addressed to our host. This step is not necessary but with it we will have complete information about network traffic.

- Step 4: Open web browser and make a request to
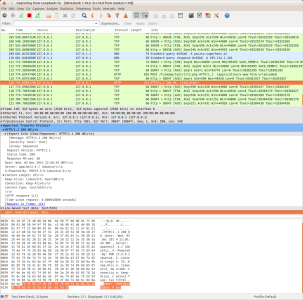
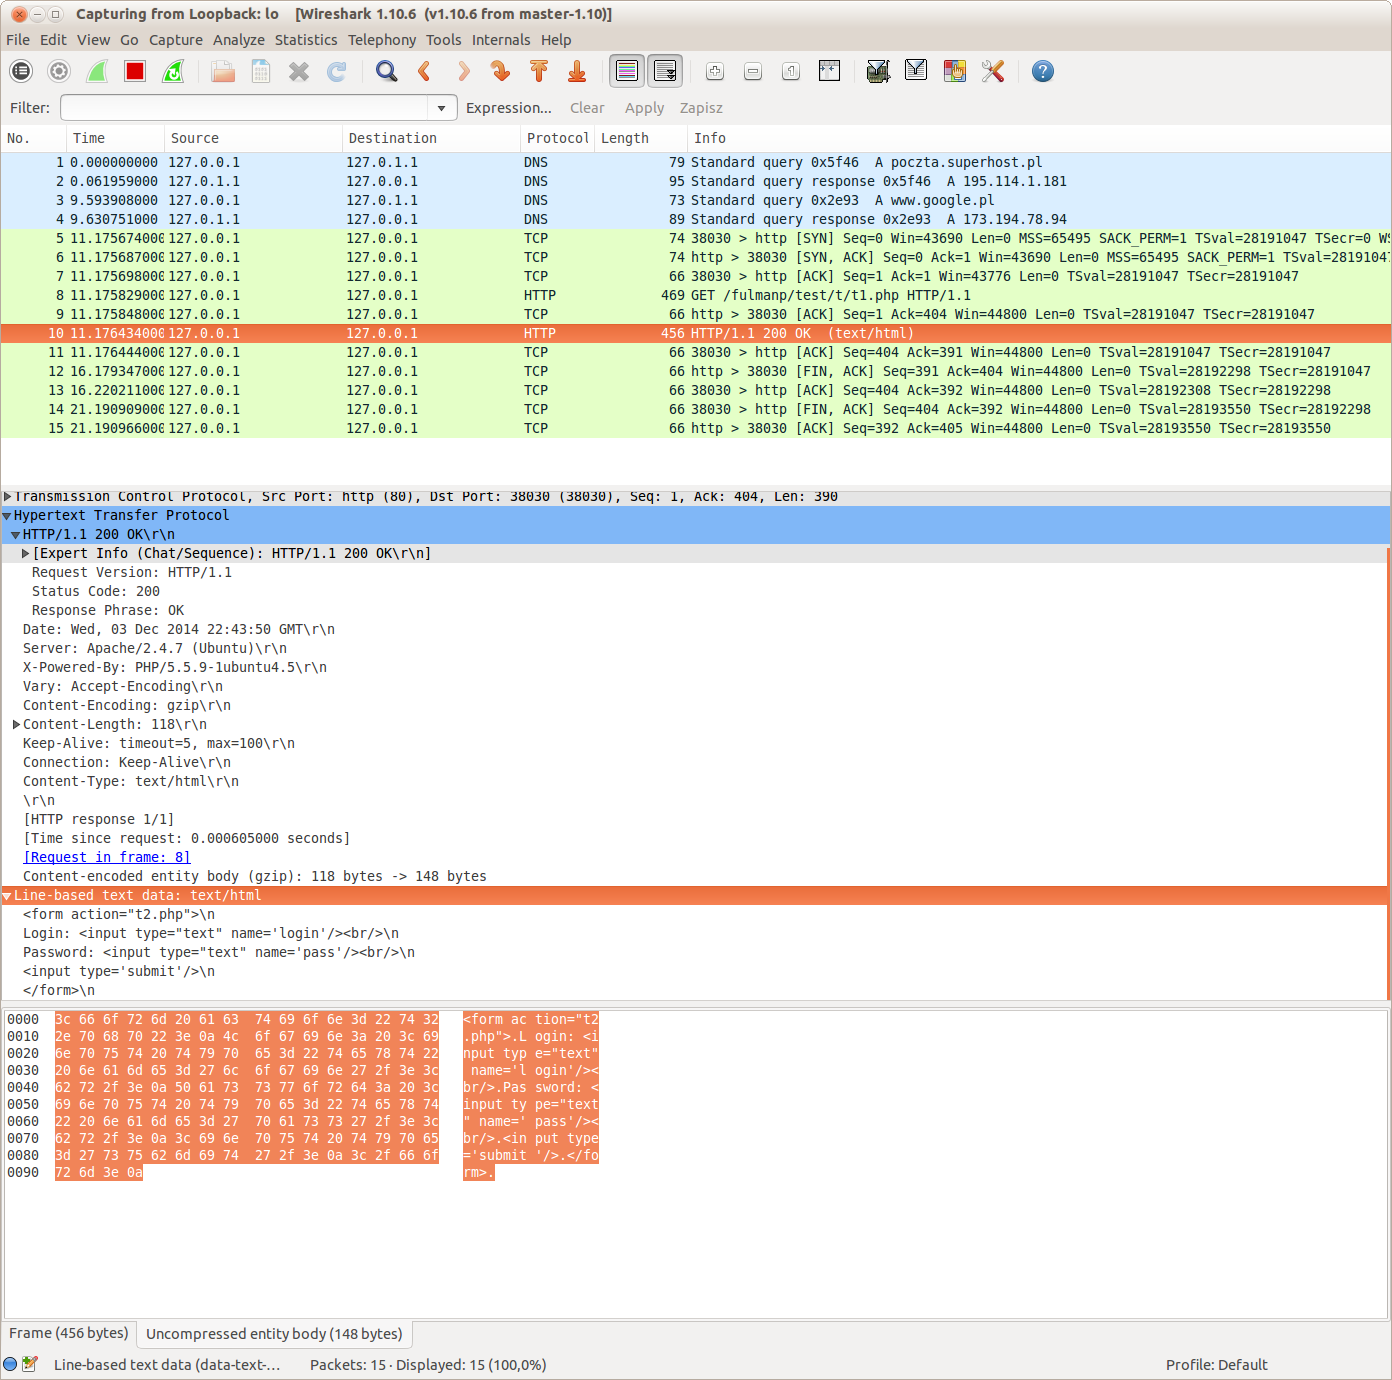
t1.phpfile; in my case this waslocalhost/fulmanp/test/t/t1. Just after you finish typing and press Enter, please switch to Wireshark. - Step 5: In Wireshark you should be able to observe your request with all its details

- Step 6: Few lins below, depending on network traffic, you should be able to find a response

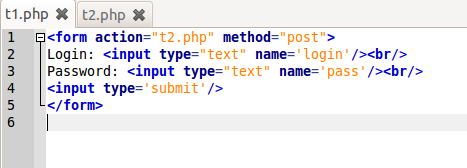
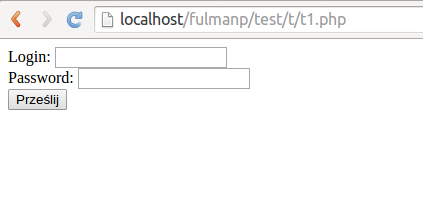
Digging into response header should expose response contents: the html code1234<form action="t2.php" method="post">Login: <input type="text" name='login'/><br/>Password: <input type="text" name='pass'/><br/><input type='submit'/>which is exactly what we have in
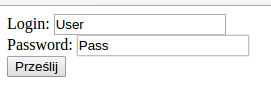
t1.phpfile. - Step 7: Now you can switch to webbrowser and check if the result corresponds to response contents
- Step 8: Please enter login and password. In this case password field is a simple text field so we could verify the result. Just after you finish typing and press Enter, please switch to Wireshark.

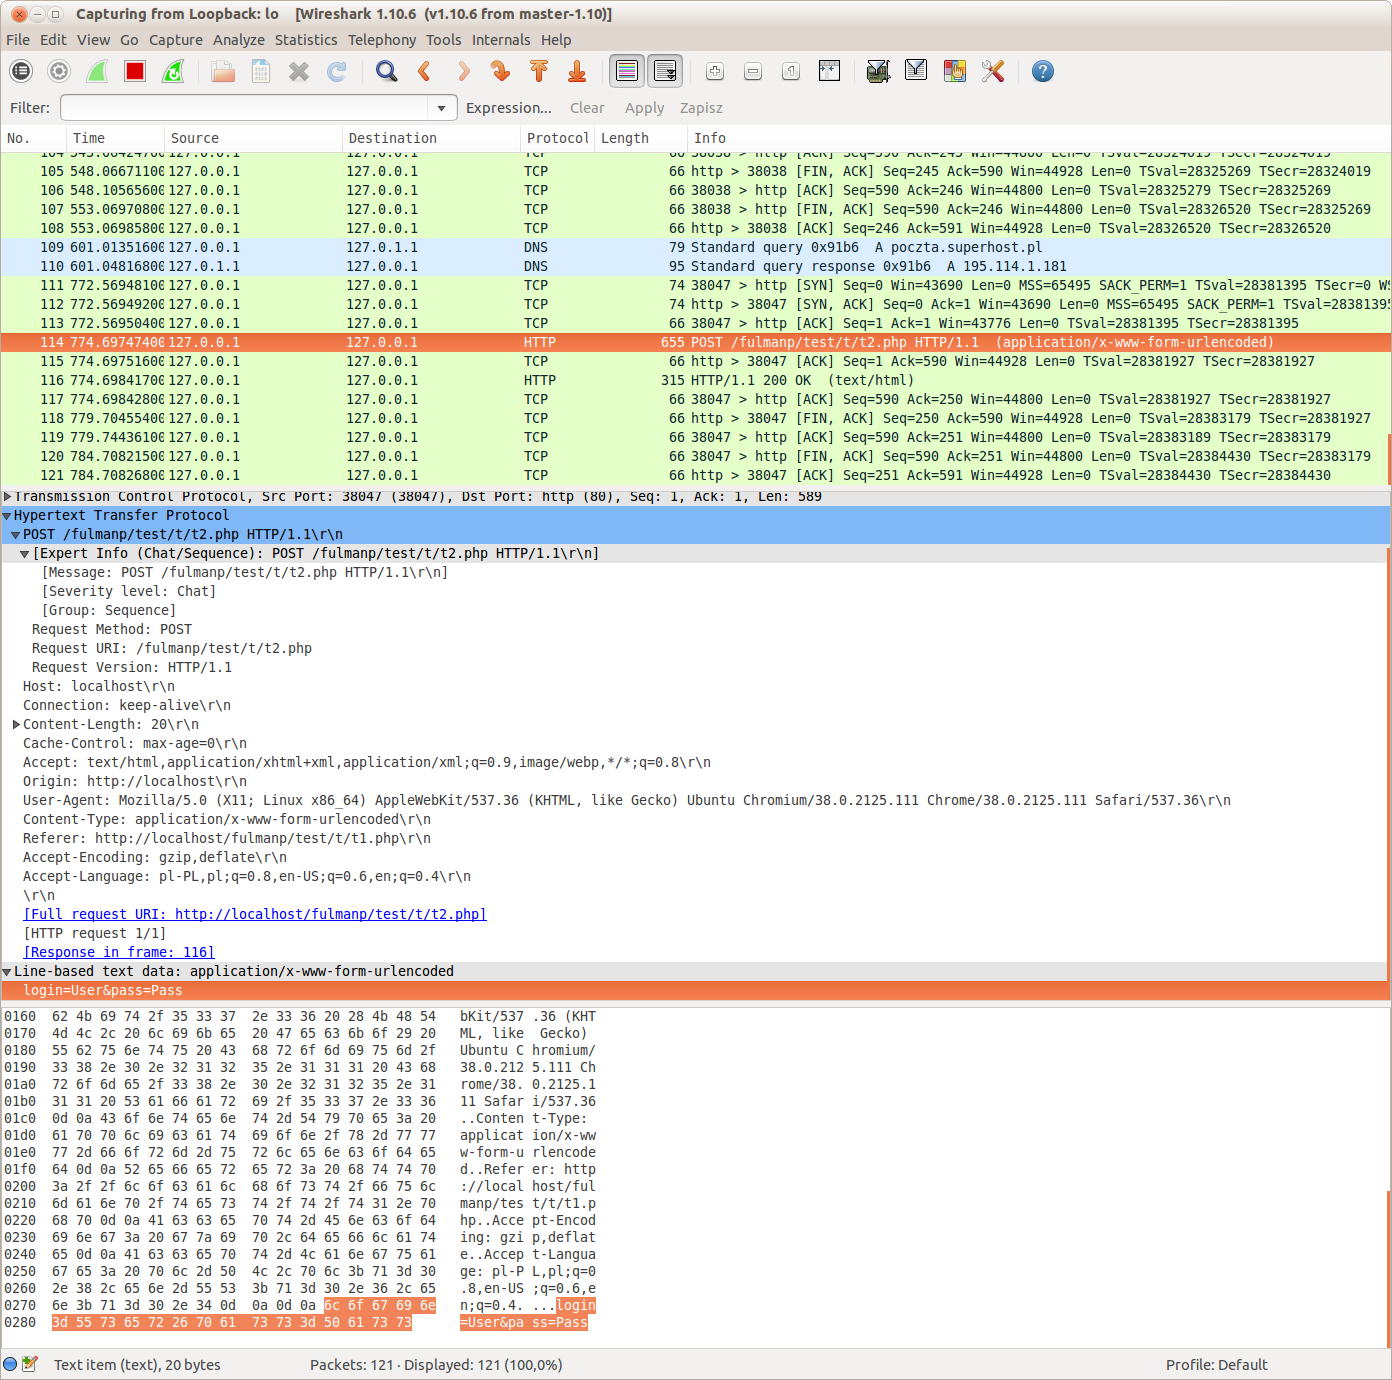
- Step 9: Again let's find
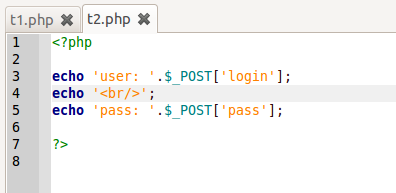
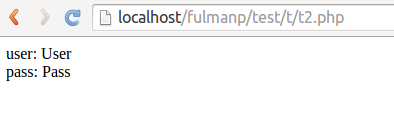
- Step 10: Examine respons. As it is coded in
t2.php, login and password should be returned
- Step 11: Now you can switch to webbrowser and chec if the result corresponds to response contents


the request and check its contents in dissector panel (packet bytes panel). You should be able to locate login and password
|

