In this tutorial you will see when data begins to speak -- this is an example of web scrapping and turning data into something useful. You will learn how to grab data, transform them and analyse.
Table of contents:
- Data source characteristic
- Examine data source
- Getting raw data
- Save data in handy data structure
- Data analysis
This year, again, I had a chance to participate in Poland Business Run charity run. Formula of this run is quite simple:
- Companies submit four-person teams to take part in the competition paying for each the starting fee - this is how funds are collected.
- Because of the pandemia, this year, similarly to 2020, you could cover the distance (4km) anywhere in the world and you could do this on your own, with your teammates or any other group, according to your preferences.
- The route must be completed between 00:00 and 18:00 Central European Summer Time (CEST).
- After finishing the race, participants individually submit their results via the mobile application or a website.
- Finally, when run ends, you can check how fast you were visiting results web page.
Visiting results web page is how you can check your personal or your team results. This is also what you can try to use to make simple date to speak to you and to turn simple data into something valuable.
This year 26799 runners has finished Poland Business Run. A lot of people, a lot of data. Let's see how you can get them.
Visiting results web page you should see something like this:

|
After scroling the table down, you will notice that data is paginated, divided into 50-records chunks:

|
At the bottom you can find two buttons to move over results with 50-records steps. If you hover over one of them, you will notice unchanged hyper reference:
|
1 |
https://live.sts-timing.pl/businessrun2021/ |
Now there are two options:
- All data are now in your web browser and only a small part is presented with JavaScript.
- Only 50 records are now in your web browser and other chunks are loaded asynchronously with JavaScript.
Let's verify which option was used in our case. Opening developer tools in my browser (in Safari select: Programowanie/Pokaż kod źródłowy strony or press Option-Command-U; alternatively you can select Programowanie/Pokaż inspektora www, or press Option-Command-I; then select Sources) for results web page I get the following result:

|
If you prefer you can use another view showing webpage elements:

|
Whatever you select, you can notice that record numer 50 is the last record. There is no more records at this moment and there are no hidden elements which are displayed by JavaScript. Base on this, you can infer that second option, with asynchronous load is used in this case.
Now you have to investigate what happens when you press Next button.
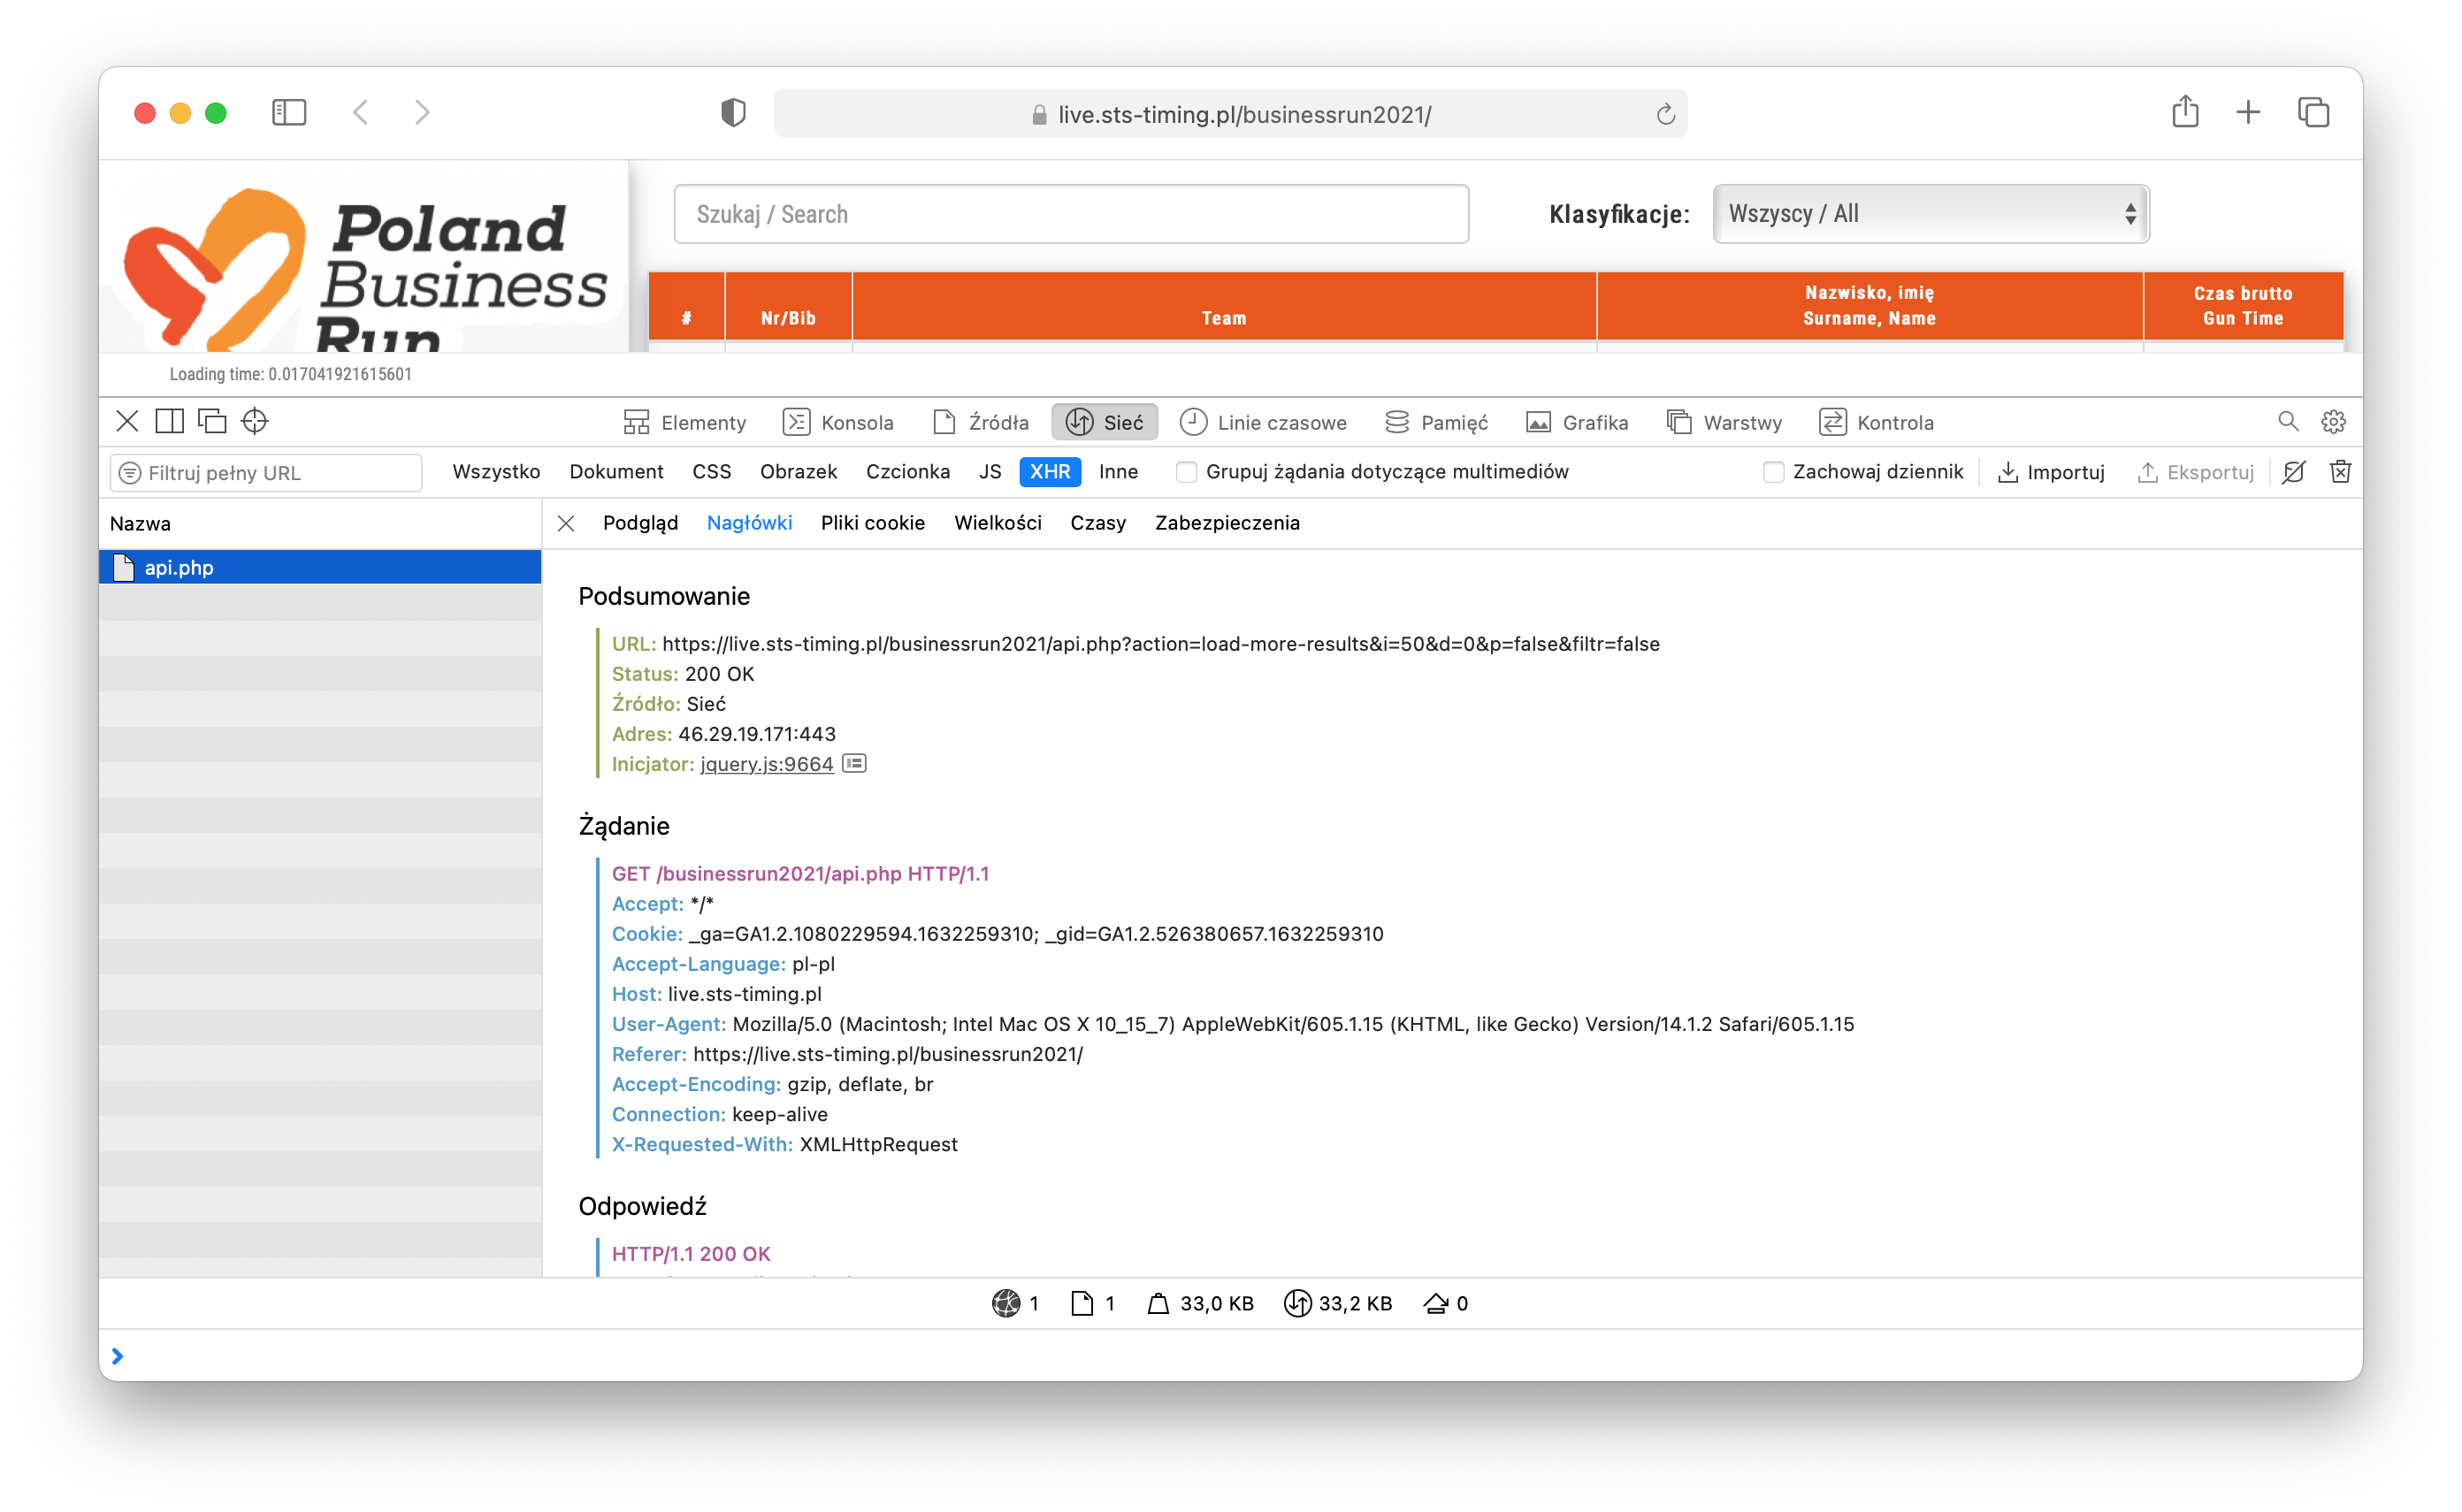
I selected Network tab in my browser and then pressed Next button. The result is given below:

|
As you can see there was a call to
|
1 |
api.php |
file. If you hover over file name, you will get a full request:

|
which in this case takes the following form:
|
1 |
https://live.sts-timing.pl/businessrun2021/api.php?action=load-more-results&i=50&d=0&p=false&filtr=false |
A full request information are available if you click on file name:
|
If you click again the Next button, request will take the form:
|
1 |
https://live.sts-timing.pl/businessrun2021/api.php?action=load-more-results&i=100&d=0&p=false&filtr=false |
Open a new tab in your browser and use the following URL:
|
1 |
https://live.sts-timing.pl/businessrun2021/api.php?action=load-more-results&i=150&d=0&p=false&filtr=false |
This should load results from 151 to 200 and this is what you really get (pbr_2021_00150.json).
Perfect! Now you know general request pattern, so everything you need is a piece of code to grab all data.
To grab all data you can use short Python script given below. Before you run this code be sure to create
raw_data directory in the same location where you keep script file.
|
1 2 3 4 5 6 7 8 9 10 11 12 13 14 15 16 17 18 19 20 21 22 23 24 25 26 27 28 29 |
import os import requests DIR_RAW_DATA = 'raw_data' def get_file_name(sequence_start): return "pbr_2021_{sequence_start:05d}.json".format(sequence_start=sequence_start) # There are 50 teams per page and 5 runners in each team # 26799 / 5 = 5359,8 = 5360 for sequence_start in range(0, 5360+50, 50): request_params = {'action': 'load-more-results', 'i': sequence_start, 'd': 0, 'p': False, 'filtr': False} result = requests.get('https://live.sts-timing.pl/businessrun2021/api.php', params = request_params) file_name = get_file_name(sequence_start) if result.status_code == 200: print("Done sequence starting from {sequence_start}, file name={file_name}".format(sequence_start=sequence_start, file_name=file_name)) with open(os.path.join(DIR_RAW_DATA, file_name), 'wb') as file_out: file_out.write(result.content) else: print("Problem with {file_name} file".format(file_name=file_name)) |
Note:
If your directory has longer path, you can build it as given below:
|
1 2 3 4 5 6 7 |
a_list = ["directory", "path", "to", "file"] file_path = os.path.join(*a_list) print(file_path) OUTPUT directory/path/to/file |
The * operator unpacks a container by producing individual elements of the container.
End note
Note:
If you work in Googl Colaboratory remember to mount your drive:
|
1 2 |
from google.colab import drive drive.mount('/content/drive') |
and next you can use your folder (in the following example my 'base folder' is bd):
|
1 2 3 4 5 |
pathComponents = ['/content','drive','MyDrive','bd',DIR_RAW_DATA] path = os.path.join(*pathComponents, fileName) with open(path, 'wb') as fileOut: fileOut.write(result.content) |
End note
It will take a few seconds to get all data. After that you can check contents of raw_data directory:
|
1 2 3 4 5 6 7 8 9 10 11 12 13 |
(base) fulmanp@fulmanp-T500:~/pbr2021$ ls -la raw_data/ razem 3452 drwxrwxr-x 2 fulmanp fulmanp 24576 wrz 22 14:32 . drwxrwxr-x 3 fulmanp fulmanp 4096 wrz 22 14:31 .. -rw-rw-r-- 1 fulmanp fulmanp 34050 wrz 22 14:32 pbr_2021_00000.json -rw-rw-r-- 1 fulmanp fulmanp 33798 wrz 22 14:32 pbr_2021_00050.json [...] -rw-rw-r-- 1 fulmanp fulmanp 34021 wrz 22 14:32 pbr_2021_04550.json -rw-rw-r-- 1 fulmanp fulmanp 34149 wrz 22 14:32 pbr_2021_04600.json -rw-rw-r-- 1 fulmanp fulmanp 8875 wrz 22 14:32 pbr_2021_04650.json -rw-rw-r-- 1 fulmanp fulmanp 23 wrz 22 14:32 pbr_2021_04700.json [...] -rw-rw-r-- 1 fulmanp fulmanp 23 wrz 22 14:32 pbr_2021_05400.json |
As you can see, pbr_2021_00000.json file has 34050 bytes (approximately 33.25)KiB, next file, pbr_2021_00050.json file has 33798 bytes (approximately 33.0KiB), and so on, till pbr_2021_04650.json file which has much less than 30kB -- to be exact, it has 8875 bytes (approximately 8.66 KiB). All the other files, starting from pbr_2021_04700.json to pbr_2021_05400.json have exactly 23 bytes which suggest that all of them are identical and no usable contents. To be sure, you can check contents of few files:
-
pbr_2021_04600.jsonfile, has the following contents:
1{"html":"<tr><td data-title=\"Miejsce\" data-breakpoints=\"xs\" style=\"white-space:nowrap;\">4601<\/td>[...]<tr><td data-title=\"Miejsce\" data-breakpoints=\"xs\" style=\"white-space:nowrap;\">4650<\/td><td>2728<\/td><td style=\"font-weight:bold;font-size:14px;\"><b>Z zadyszk\u0105 w stron\u0119 s\u0142o\u0144ca (2728)<\/b><\/td><td class=\"text-left\">(2728\/1) <a href=\"person.php?n=2728\/1\">Kr\u00f3l - Maziarz Karolina<\/a> - 01:30:53<br>(2728\/2) <a href=\"person.php?n=2728\/2\">Kokoszka Kamil<\/a> - 00:23:00<br>(2728\/3) <a href=\"person.php?n=2728\/3\">Kad\u0142ubowska-Mruk Sylwia<\/a> - 00:44:01<br>(2728\/4) <a href=\"person.php?n=2728\/4\">Kuchta Bartosz<\/a> - 01:59:58<br>(2728\/5) <a href=\"person.php?n=2728\/5\">Szymczak Adam<\/a> - 00:42:14<br><td class=\"t\">05:20:06<\/td><td class=\"st\">-<\/td><\/tr>","last":4650}
Data starts from 4601 to 4650, so there are 50 records inside. -
pbr_2021_04650.jsonfile, which looks like below:
1{"html":"<tr><td data-title=\"Miejsce\" data-breakpoints=\"xs\" style=\"white-space:nowrap;\">4651<\/td>[...]<tr><td data-title=\"Miejsce\" data-breakpoints=\"xs\" style=\"white-space:nowrap;\">4663<\/td><td>1027<\/td><td style=\"font-weight:bold;font-size:14px;\"><b>Levi's Wroc\u0142aw (1027)<\/b><\/td><td class=\"text-left\">(1027\/1) <a href=\"person.php?n=1027\/1\">Czerniak Adam<\/a> - 01:59:58<br>(1027\/2) <a href=\"person.php?n=1027\/2\">Szyma\u0144ski Dominik<\/a> - 01:54:20<br>(1027\/3) <a href=\"person.php?n=1027\/3\">Kasprzyk Patrycja<\/a> - 01:05:47<br>(1027\/4) <a href=\"person.php?n=1027\/4\">\u0141acina Alicja<\/a> - 01:25:53<br>(1027\/5) <a href=\"person.php?n=1027\/5\">Smog\u00f3r Micha\u0142<\/a> - 01:15:25<br><td class=\"t\">07:41:23<\/td><td class=\"st\">-<\/td><\/tr>","last":4663}
Data starts from 4651 to 4663, so the difference is less than expected 50. -
pbr_2021_04700.jsonfile, which is really simple:
1{"html":"","last":4700}
Yes, there is nothing interesting in these files.
When you have all raw data, it's time to extract html code. You can complete this with simple code given below (extract_html.py):
|
1 2 3 4 5 6 7 8 9 10 11 12 13 14 15 16 17 18 19 |
import json import os DIR_RAW_DATA = r'raw_data' DIR_HTML = 'html' directory = DIR_RAW_DATA for fileName in os.listdir(directory): if fileName.endswith(".json"): print('Read file {fileName}'.format(fileName=fileName)) with open(os.path.join(DIR_RAW_DATA, fileName)) as file_in: fileNameNew = fileName.replace(".json", ".htm") with open(os.path.join(DIR_HTML, fileNameNew), 'wt') as file_out: dictionary = json.load(file_in) file_out.write(dictionary["html"]) |
Unfortunately at some point you will get result similar to the following:
|
1 2 3 4 5 6 7 8 9 10 11 12 13 |
Read file pbr_2021_02250.json Traceback (most recent call last): File "extract_html.py", line 14, in <module> dictionary = json.load(file_in) File "/home/fulmanp/anaconda3/lib/python3.7/json/__init__.py", line 296, in load parse_constant=parse_constant, object_pairs_hook=object_pairs_hook, **kw) File "/home/fulmanp/anaconda3/lib/python3.7/json/__init__.py", line 348, in loads return _default_decoder.decode(s) File "/home/fulmanp/anaconda3/lib/python3.7/json/decoder.py", line 337, in decode obj, end = self.raw_decode(s, idx=_w(s, 0).end()) File "/home/fulmanp/anaconda3/lib/python3.7/json/decoder.py", line 355, in raw_decode raise JSONDecodeError("Expecting value", s, err.value) from None json.decoder.JSONDecodeError: Expecting value: line 1 column 1 (char 0) |
This means that there is something wrong with pbr_2021_02250.json file. If you take a closer look into its contents, you will notice unexpected message inside:
|
1 2 3 |
<br /> <b>Notice</b>: Trying to get property of non-object in <b>/var/www/html/businessrun2021/api.php</b> on line <b>161</b><br /> {"html":"<tr><td data-title=\"Miejsce\" data-breakpoints=\"xs\" style=\"white-space:nowrap;\">2251<\/td><td>4591<\/td>[...]<tr><td data-title=\"Miejsce\" data-breakpoints=\"xs\" style=\"white-space:nowrap;\">2300<\/td><td>5278<\/td><td style=\"font-weight:bold;font-size:14px;\"><b>Bee Talents (5278)<\/b><\/td><td class=\"text-left\">(5278\/1) <a href=\"person.php?n=5278\/1\">Domachowska Dominka<\/a> - 00:20:12<br>(5278\/2) <a href=\"person.php?n=5278\/2\">Durka Natalia<\/a> - 00:34:39<br>(5278\/3) <a href=\"person.php?n=5278\/3\">Grzesiak Olga<\/a> - 00:25:05<br>(5278\/4) <a href=\"person.php?n=5278\/4\">Ganowicz Igor<\/a> - 00:20:06<br>(5278\/5) <a href=\"person.php?n=5278\/5\">Szulakiewicz Maciej<\/a> - 00:23:48<br><td class=\"t\">02:03:50<\/td><td class=\"st\">-<\/td><\/tr>","last":2300} |
Remove non-json part:
|
1 2 |
<br /> <b>Notice</b>: Trying to get property of non-object in <b>/var/www/html/businessrun2021/api.php</b> on line <b>161</b><br /> |
from pbr_2021_02250.json file and again run extract_html.py script. This time your run shouldn't be interrupted by unexpected data.
Finally at this step you should get html code (html.zip) extracted from raw data you grabbed at the beginning (raw_data_original.zip).
HTML file is not bad data format, but a little bit difficult to further processing, so it would be nice to have all of them in more handy form, like for example csv.
To make this transformation, you have to examine HTML content first. You can select any HTML file, for example pbr_2021_00000.htm:
|
1 |
<tr><td data-title="Miejsce" data-breakpoints="xs" style="white-space:nowrap;">1</td><td>245</td><td style="font-weight:bold;font-size:14px;"><b>#AdamCzerwińskiTeam (245)</b></td><td class="text-left">(245/1) <a href="person.php?n=245/1">Czerwiński Adam</a> - 00:11:35<br>(245/2) <a href="person.php?n=245/2">Piwowarczyk Dominik</a> - 00:12:25<br>(245/3) <a href="person.php?n=245/3">Gajdowski Oliver</a> - 00:12:31<br>(245/4) <a href="person.php?n=245/4">Wrona Daniel</a> - 00:13:16<br>(245/5) <a href="person.php?n=245/5">Ogorzały Tomasz</a> - 00:12:47<br><td class="t">01:02:34</td><td class="st">-</td></tr> [...] |
Unfortunatley it is a one very long line. Rearanging HTML for better visualisation you will see:
|
1 2 3 4 5 6 7 8 9 10 11 12 13 14 |
<tr> <td data-title="Miejsce" data-breakpoints="xs" style="white-space:nowrap;">1</td> <td>245</td> <td style="font-weight:bold;font-size:14px;"><b>#AdamCzerwińskiTeam (245)</b></td> <td class="text-left"> (245/1)<a href="person.php?n=245/1">Czerwiński Adam</a> - 00:11:35<br> (245/2)<a href="person.php?n=245/2">Piwowarczyk Dominik</a> - 00:12:25<br> (245/3)<a href="person.php?n=245/3">Gajdowski Oliver</a> - 00:12:31<br> (245/4)<a href="person.php?n=245/4">Wrona Daniel</a> - 00:13:16<br> (245/5)<a href="person.php?n=245/5">Ogorzały Tomasz</a> - 00:12:47<br> <td class="t">01:02:34</td> <td class="st">-</td> </tr> [...] |
Now you can see, that this HTML is not perfectly correct, because the closing tag for <td class="text-left"> is missing. To parse this HTML you can use ready to use libraries like BeautifulSoup. For production purposes this is a good approach, but now I want to show you how you can complete this with powerful regular expressions.
First, you will find all rows -- group of characters between <tr> and <tr/> tag. You can use the following regular expression:
|
1 |
(?P<row><tr>.*?</tr>) |
Why .*? instead of simply .* where . matches any character (except for line terminators) and * matches the previous token between zero and unlimited times, as many times as possible?
Because * is a greede quantifier, while *? is a lazy quantifier. Difference is given on the images below:

|

|
You can use Positive Lookbehind (?<=...) and Positive Lookahead (?=...) to extract what is between <tr> and <tr/> tag skiping this tag itself:
|
1 |
(?P<row>(?<=<tr>).*?(?=</tr>)) |

|
This way you extrac exactly one row od data. Now it's time to parse this row itself.
With expression
|
1 |
(?<=<td data).*?>(?P<position>\d*) |
you can extract information about team's position:

|
Similarly team number:
|
1 |
(?<=<td>)(?P<teamNumber>\d*) |

|
team name:
|
1 |
(?<=<td style).*?<b>(?P<teamName>.*?)\s\(\d*\)</b> |

|
person order and time:
|
1 |
\(\d*/(?P<personNumber>\d*)\).*?<a.*?>(?P<personName>.*?)</a>.*?(?P<personTime>\d{2}:\d{2}:\d{2}) |

|
and total team time:
|
1 |
(?<=<td class=\"t\">)(?P<totalTime>\d{2}:\d{2}:\d{2}) |

|
Below you have a full code to complete this task:
|
1 2 3 4 5 6 7 8 9 10 11 12 13 14 15 16 17 18 19 20 21 22 23 24 25 26 27 28 29 30 31 32 33 34 35 36 37 38 39 40 41 42 43 44 45 46 47 48 49 50 51 52 53 54 55 56 57 58 |
import os import re currentDirectory = os.path.abspath(os.path.dirname(__file__)) currentDirectory = os.path.join(currentDirectory, "html") def processFile(filePath, fileToSaveData): reRow = re.compile("(?P<row>(?<=<tr>).*?(?=</tr>))") rePosition = re.compile("(?<=<td data).*?>(?P<position>\d*)") reTeamNumber = re.compile("(?<=<td>)(?P<teamNumber>\d*)") reTeamName = re.compile("(?<=<td style).*?<b>(?P<teamName>.*?)\s\(\d*\)</b>") rePersonalData = re.compile("\(\d*/(?P<personNumber>\d*)\).*?<a.*?>(?P<personName>.*?)</a>.*?(?P<personTime>\d{2}:\d{2}:\d{2})") reTotalTime = re.compile("(?<=<td class=\"t\">)(?P<totalTime>\d{2}:\d{2}:\d{2})") with open(filePath) as fileIn: lines = fileIn.readlines() text = "".join(lines) result = re.findall(reRow, text) if result: for row in result: position = re.findall(rePosition, row) teamNumber = re.findall(reTeamNumber, row) teamName = re.findall(reTeamName, row) totalTime = re.findall(reTotalTime, row) personalData = re.findall(rePersonalData, row) r = f"{position[0]},{teamNumber[0]},{teamName[0]},{totalTime[0]}" person = [] time = [] for _person in personalData: _number, _name, _time = _person person.append((_number, _name)) time.append(_time) for t in time: r += f",{t}" for p in person: r += f",{p[0]},{p[1]}" fileToSaveData.write(r + "\n") with open("data.csv", 'w') as fileToSaveData: for fileName in os.listdir(currentDirectory): if fileName.endswith(".htm"): filePath = os.path.join(currentDirectory, fileName) size = os.path.getsize(filePath) if size == 0: print("Skip file {} because of its size {}B".format(fileName, str(size))) else: processFile(filePath, fileToSaveData) else: print("Skip file {} as non-HTML file".format(fileName)) |
When tested on first two records (saved in html_record_1_2.htm file and html directory):
|
1 |
<tr><td data-title="Miejsce" data-breakpoints="xs" style="white-space:nowrap;">1</td><td>245</td><td style="font-weight:bold;font-size:14px;"><b>#AdamCzerwińskiTeam (245)</b></td><td class="text-left">(245/1) <a href="person.php?n=245/1">Czerwiński Adam</a> - 00:11:35<br>(245/2) <a href="person.php?n=245/2">Piwowarczyk Dominik</a> - 00:12:25<br>(245/3) <a href="person.php?n=245/3">Gajdowski Oliver</a> - 00:12:31<br>(245/4) <a href="person.php?n=245/4">Wrona Daniel</a> - 00:13:16<br>(245/5) <a href="person.php?n=245/5">Ogorzały Tomasz</a> - 00:12:47<br><td class="t">01:02:34</td><td class="st">-</td></tr><tr><td data-title="Miejsce" data-breakpoints="xs" style="white-space:nowrap;">2</td><td>3887</td><td style="font-weight:bold;font-size:14px;"><b>MANUFAKTURA MIESZKAŃ (3887)</b></td><td class="text-left">(3887/1) <a href="person.php?n=3887/1">Sobczyk Patryk</a> - 00:13:17<br>(3887/2) <a href="person.php?n=3887/2">Jastrzębski Sebastian</a> - 00:12:32<br>(3887/3) <a href="person.php?n=3887/3">Gorzelańczyk Paweł</a> - 00:14:32<br>(3887/4) <a href="person.php?n=3887/4">Graczyk Adrian</a> - 00:12:30<br>(3887/5) <a href="person.php?n=3887/5">Mikołajczak Hubert</a> - 00:14:29<br><td class="t">01:07:20</td><td class="st">-</td></tr> |
it returns the following result:
|
1 2 3 4 5 6 7 8 9 10 11 12 13 14 15 16 17 18 19 |
macbook-piotr:talk_with_data fulmanp$ ls -l total 24 -rw-r--r--@ 1 fulmanp staff 1045 31 paź 08:29 data_grabber.py -rw-r--r--@ 1 fulmanp staff 493 31 paź 08:29 extract_html.py -rw-r--r--@ 1 fulmanp staff 2027 4 sty 10:43 htm2csv.py drwxr-xr-x@ 3 fulmanp staff 96 4 sty 10:47 html macbook-piotr:talk_with_data fulmanp$ python3 htm2csv.py macbook-piotr:talk_with_data fulmanp$ ls -l total 32 -rw-r--r-- 1 fulmanp staff 362 4 sty 10:49 data.csv -rw-r--r--@ 1 fulmanp staff 1045 31 paź 08:29 data_grabber.py -rw-r--r--@ 1 fulmanp staff 493 31 paź 08:29 extract_html.py -rw-r--r--@ 1 fulmanp staff 2027 4 sty 10:43 htm2csv.py drwxr-xr-x@ 3 fulmanp staff 96 4 sty 10:47 html macbook-piotr:talk_with_data fulmanp$ wc data.csv 2 13 362 data.csv macbook-piotr:talk_with_data fulmanp$ cat data.csv 1,245,#AdamCzerwińskiTeam,01:02:34,00:11:35,00:12:25,00:12:31,00:13:16,00:12:47,1,Czerwiński Adam,2,Piwowarczyk Dominik,3,Gajdowski Oliver,4,Wrona Daniel,5,Ogorzały Tomasz 2,3887,MANUFAKTURA MIESZKAŃ,01:07:20,00:13:17,00:12:32,00:14:32,00:12:30,00:14:29,1,Sobczyk Patryk,2,Jastrzębski Sebastian,3,Gorzelańczyk Paweł,4,Graczyk Adrian,5,Mikołajczak Hubert |
If everything is correct, you can remove html_record_1_2.htm file from the html directory and put there all your html file from previous step.
|
1 2 3 4 5 6 7 8 9 10 11 12 13 14 15 16 17 18 19 |
macbook-piotr:talk_with_data fulmanp$ python3 htm2csv.py Skip file pbr_2021_04700.htm because of its size 0B Skip file pbr_2021_05350.htm because of its size 0B Skip file pbr_2021_05150.htm because of its size 0B Skip file pbr_2021_04850.htm because of its size 0B Skip file .DS_Store as non-HTML file Skip file pbr_2021_05050.htm because of its size 0B Skip file pbr_2021_04950.htm because of its size 0B Skip file pbr_2021_05250.htm because of its size 0B Skip file pbr_2021_05300.htm because of its size 0B Skip file pbr_2021_04750.htm because of its size 0B Skip file pbr_2021_05100.htm because of its size 0B Skip file pbr_2021_04800.htm because of its size 0B Skip file pbr_2021_05400.htm because of its size 0B Skip file pbr_2021_05000.htm because of its size 0B Skip file pbr_2021_04900.htm because of its size 0B Skip file pbr_2021_05200.htm because of its size 0B macbook-piotr:talk_with_data fulmanp$ wc data.csv 4663 36473 812210 data.csv |
In case of any problems, you can download my data.csv file.
At this moment, you can make any data analysis you want. Next part of this material is devoted to some analysis, but of course you are free to squeeze as much information as you only can.
In this part I will use Google Colab(oratory). I'm not a big fan of a such solutions, but for didactic purposes it is realy perfect.
Start with uploading data.csv file to your Google Drive; I saved it in pbr_2021 directory:

|
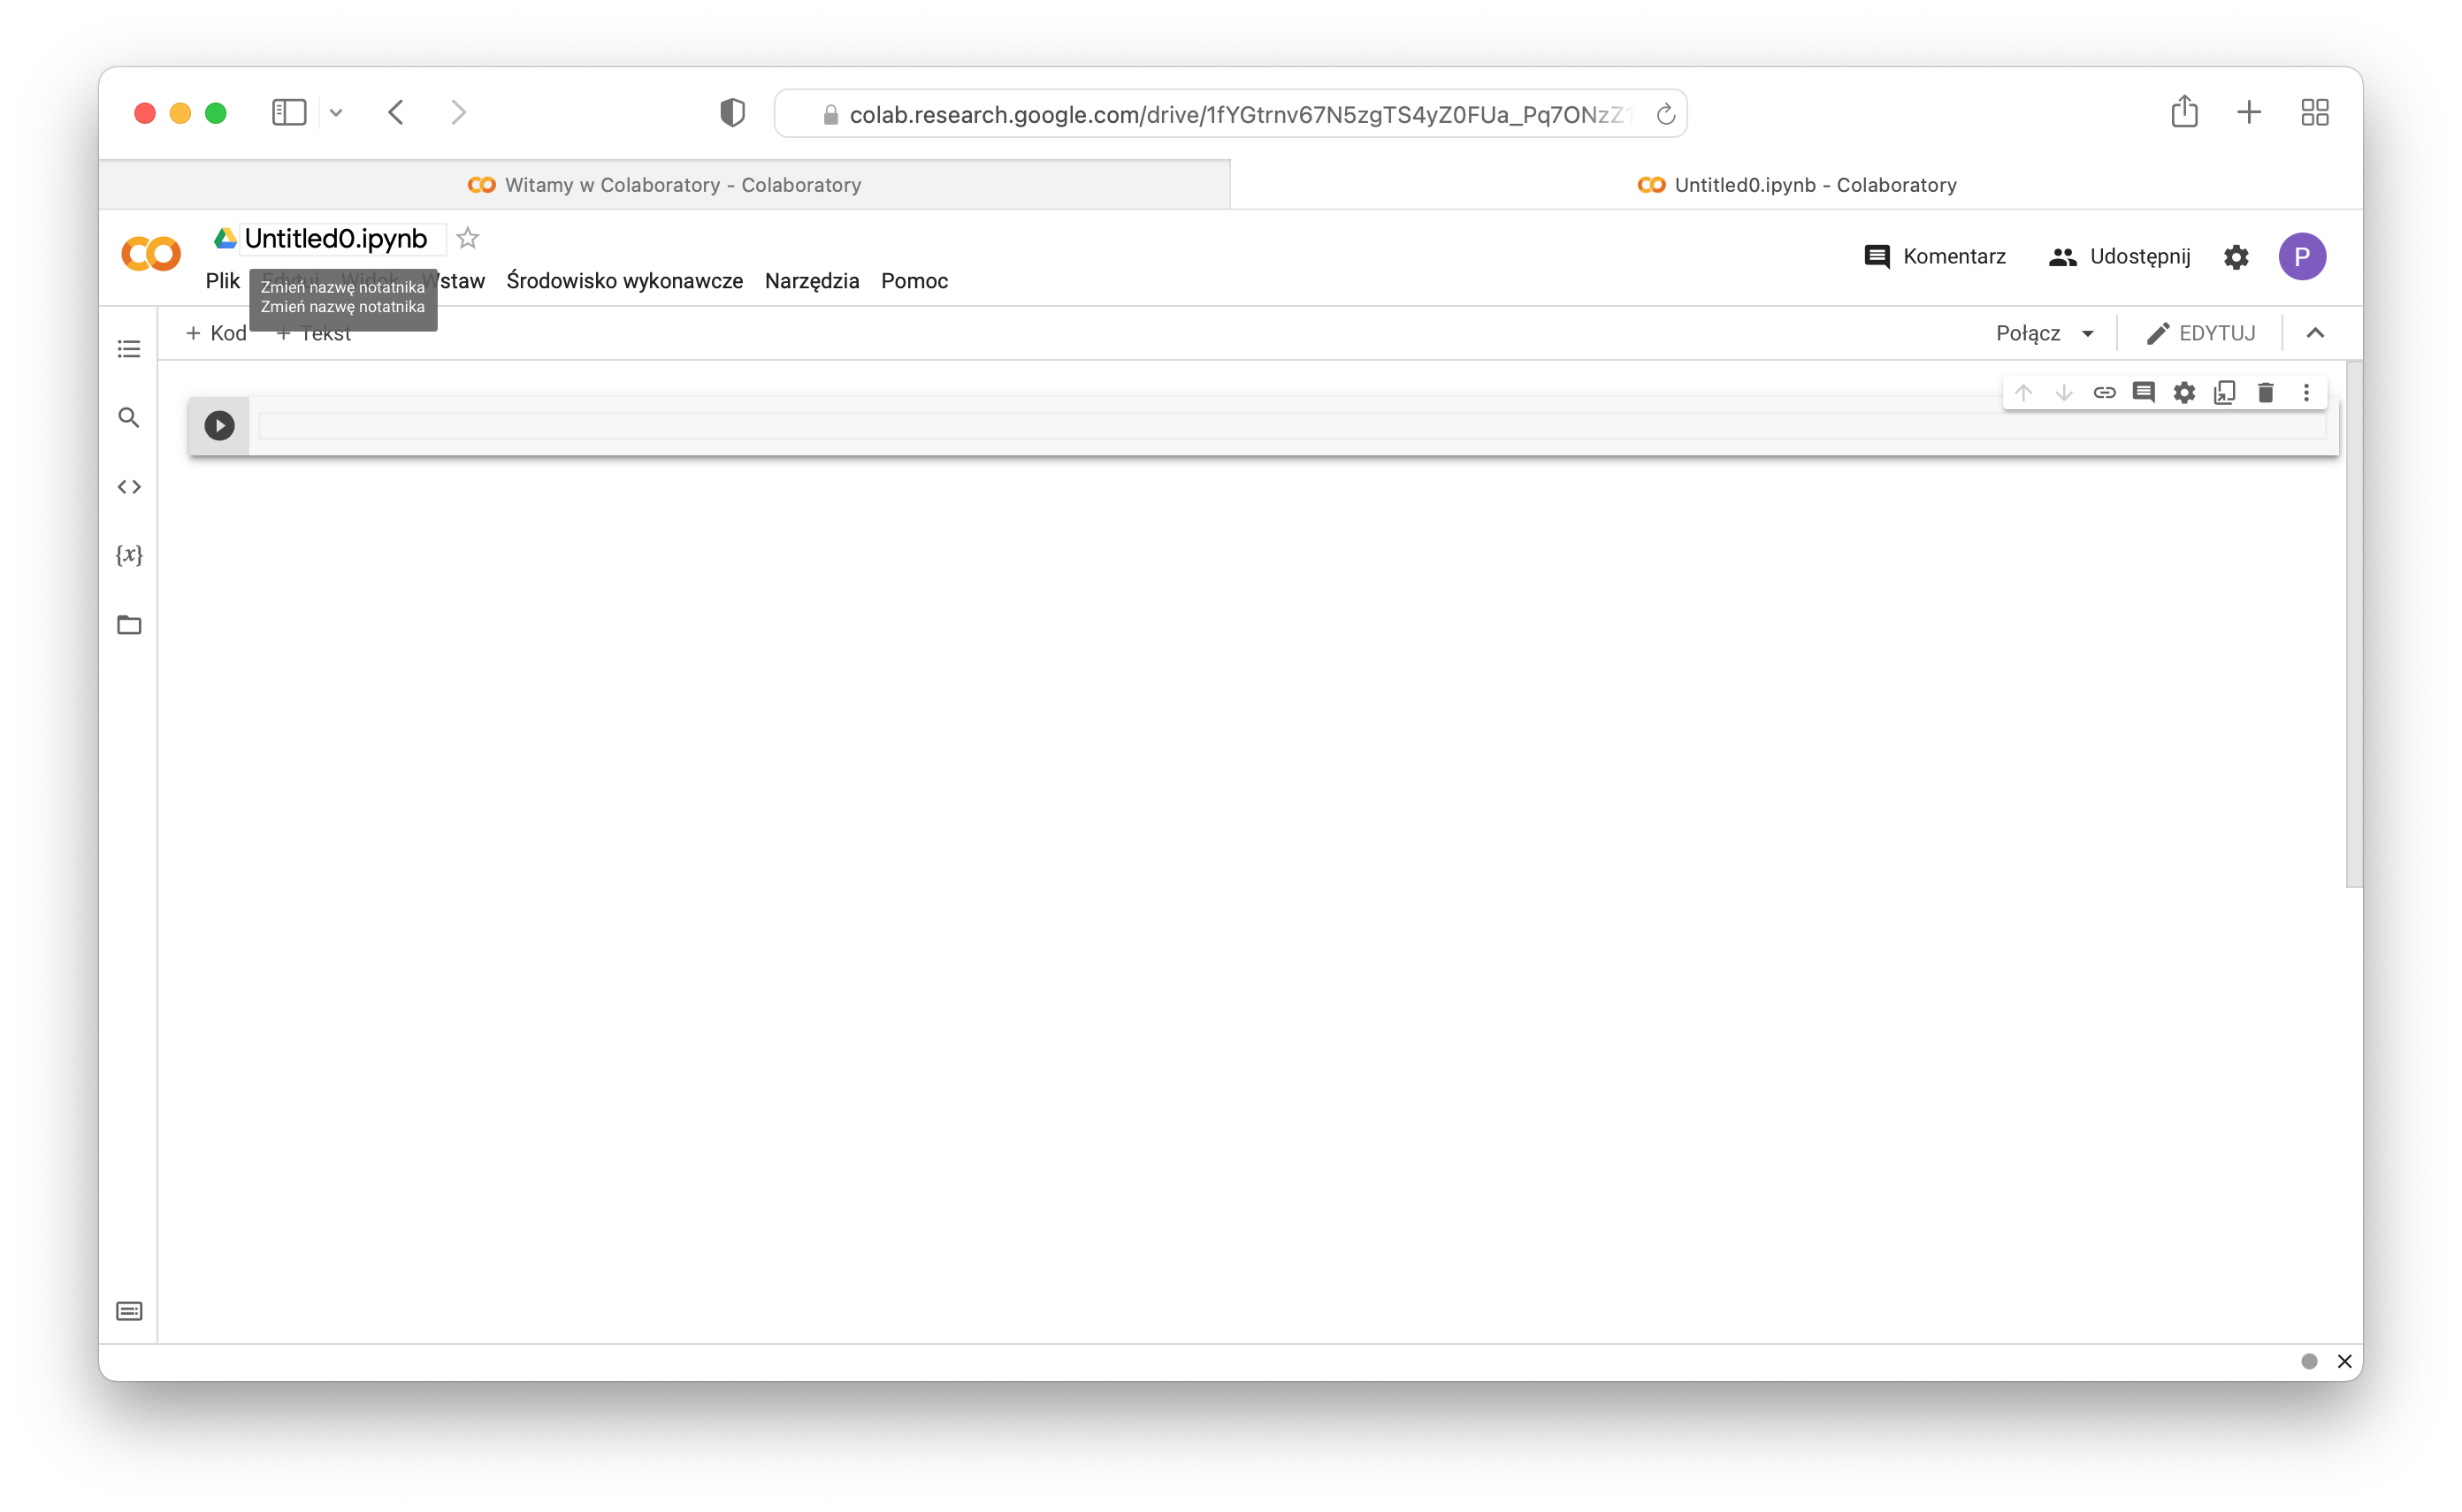
Next you have to login to your Google Colab and start new notebook either just afer login (left image below) or later selecting right option from top menu (right image below):

|

|
| Starting new notebook just after login (left) or later selecting right option from top menu (right) | |
Name it pbr_2021:
|

|
First, most obvious task, is loading our data. Display all your files:

|
Connect to your Google Drive:

|

|

|
When you see your Google Drive files in the left pane (file explorer), right click on the file that you need to import and select Copy path. Then import as usual in pandas, using this copied path:
|
1 2 |
import pandas as pd df=pd.read_csv('/content/drive/MyDrive/pbr_2021/data.csv') |

|

|
and run it. Ups...
|
1 |
ParserError: Error tokenizing data. C error: Expected 19 fields in line 61, saw 21 |
Checking you will see:
|
1 |
2611,3405,Run, Forecast, run!,02:07:57,00:16:05,00:17:51,00:48:27,00:21:53,00:23:41,1,Błasiak Jacek,2,Wzgarda Marcin,3,Skałban Anna,4,Małgorzaciak Liliana,5,Nowak Paweł |
Funny! As you can see, in this case team's name is Run, Forecast, run!. Commas in team's name are interpreted as field separator!
Go back to htm2csv.py file and replace , with ;. Find following lines:
|
1 2 3 4 5 |
r = f"{position[0]},{teamNumber[0]},{teamName[0]},{totalTime[0]}" [...] r += f",{t}" [...] r += f",{p[0]},{p[1]}" |
and do replacement six times:
|
1 2 3 4 5 |
r = f"{position[0]};{teamNumber[0]};{teamName[0]};{totalTime[0]}" [...] r += f";{t}" [...] r += f";{p[0]};{p[1]}" |
After this modification you can run your script again and check results:
|
1 2 3 4 5 6 7 8 9 10 11 12 13 14 15 16 17 18 19 20 21 22 23 24 25 26 27 28 29 30 |
macbook-piotr:talk_with_data fulmanp$ python3 htm2csv.py Skip file pbr_2021_04700.htm because of its size 0B Skip file pbr_2021_05350.htm because of its size 0B Skip file pbr_2021_05150.htm because of its size 0B Skip file pbr_2021_04850.htm because of its size 0B Skip file .DS_Store as non-HTML file Skip file pbr_2021_05050.htm because of its size 0B Skip file pbr_2021_04950.htm because of its size 0B Skip file pbr_2021_05250.htm because of its size 0B Skip file pbr_2021_05300.htm because of its size 0B Skip file pbr_2021_04750.htm because of its size 0B Skip file pbr_2021_05100.htm because of its size 0B Skip file pbr_2021_04800.htm because of its size 0B Skip file pbr_2021_05400.htm because of its size 0B Skip file pbr_2021_05000.htm because of its size 0B Skip file pbr_2021_04900.htm because of its size 0B Skip file pbr_2021_05200.htm because of its size 0B macbook-piotr:talk_with_data fulmanp$ head data.csv 3251;910;Arjo Finansjera;02:17:45;00:21:56;00:28:03;00:30:59;00:24:49;00:31:58;1;Morkowski Maciej;2;Półrolniczak Jarosław;3;Juśkiewicz Sylwia;4;Świercz Marta;5;Łechtańska Klaudia 3252;2711;KIUSIU;02:17:45;00:37:27;00:18:20;00:24:15;00:26:00;00:31:43;1;Górska Weronika;2;Łysowski Damian;3;Kitowski Kamil;4;Kowalczyk Maria;5;Sprawka Agnieszka 3253;3413;Zabiegani;02:17:45;00:26:50;00:28:32;00:26:14;00:29:00;00:27:09;1;Michałek Daniel;2;Tok Monika;3;Kostrzewska Agata;4;Ryczek Małgorzata;5;Radkowska Magdalena 3254;5475;Ferrero 10;02:17:45;00:44:33;00:24:22;00:23:01;00:18:39;00:27:10;1;Jagiełło Edyta;2;Szymańska Aleksandra;3;Chmielewski Piotr;4;Chmielewski Robert;5;Chmielewska Wioleta 3255;705;Laguny z finansów;02:17:47;00:34:47;00:19:31;00:27:49;00:28:36;00:27:04;1;Broniarz Paulina;2;Strupiechowska Marlena;3;Tarkowska Katarzyna;4;Banat Alina;5;Kwapisiewicz Sylwia 3256;3044;ForLogistic.com;02:17:47;00:33:17;00:30:59;00:20:59;00:21:07;00:31:25;1;Lis Albert;2;Mikołajczyk Zlatina;3;Gasiul Damian;4;Bohoriev Anatolii;5;Woźniak Maciej 3257;3383;PreZero Recyklersi;02:17:47;00:48:02;00:24:30;00:24:48;00:20:30;00:19:57;1;Krasicka Adrianna;2;Majerczak Kamil;3;Dudziak Michał;4;Grzelczyk Krzysztof;5;Gierczak Marek 3258;4182;Team Jerome;02:17:47;00:21:10;00:27:29;00:24:40;00:39:42;00:24:46;1;Lemparty Mariusz;2;Kulik-Kiernoz Katarzyna;3;Lafuite Jerome;4;Czemerska Anna;5;Pykacz Aleksandra 3259;794;HR Beat;02:17:48;00:26:15;00:25:10;00:30:15;00:28:00;00:28:08;1;Styperek Przemysław;2;Murawski Marcin;3;Sołowiński Adrian;4;Mierzbiczak Karina;5;Piotrowski Bartłomiej 3260;4054;Stretto Team STRACIŁEM WĘCH;02:17:49;00:17:51;00:27:55;00:34:52;00:30:43;00:26:28;1;Kmieć Gerard;2;Cichocki Andrzej;3;Ciesielska Renata;4;Kwiatkowski Jakub;5;Góral Grzegorz macbook-piotr:talk_with_data fulmanp$ cat data.csv | grep Forecast 2611;3405;Run, Forecast, run!;02:07:57;00:16:05;00:17:51;00:48:27;00:21:53;00:23:41;1;Błasiak Jacek;2;Wzgarda Marcin;3;Skałban Anna;4;Małgorzaciak Liliana;5;Nowak Paweł |
In case of any problems, you can download my data.csv file.
Upload new csv file to Google drive and again try to load data. Now you encounter similar problem but in line 2168:
|
1 |
ParserError: Error tokenizing data. C error: Expected 19 fields in line 2168, saw 20 |
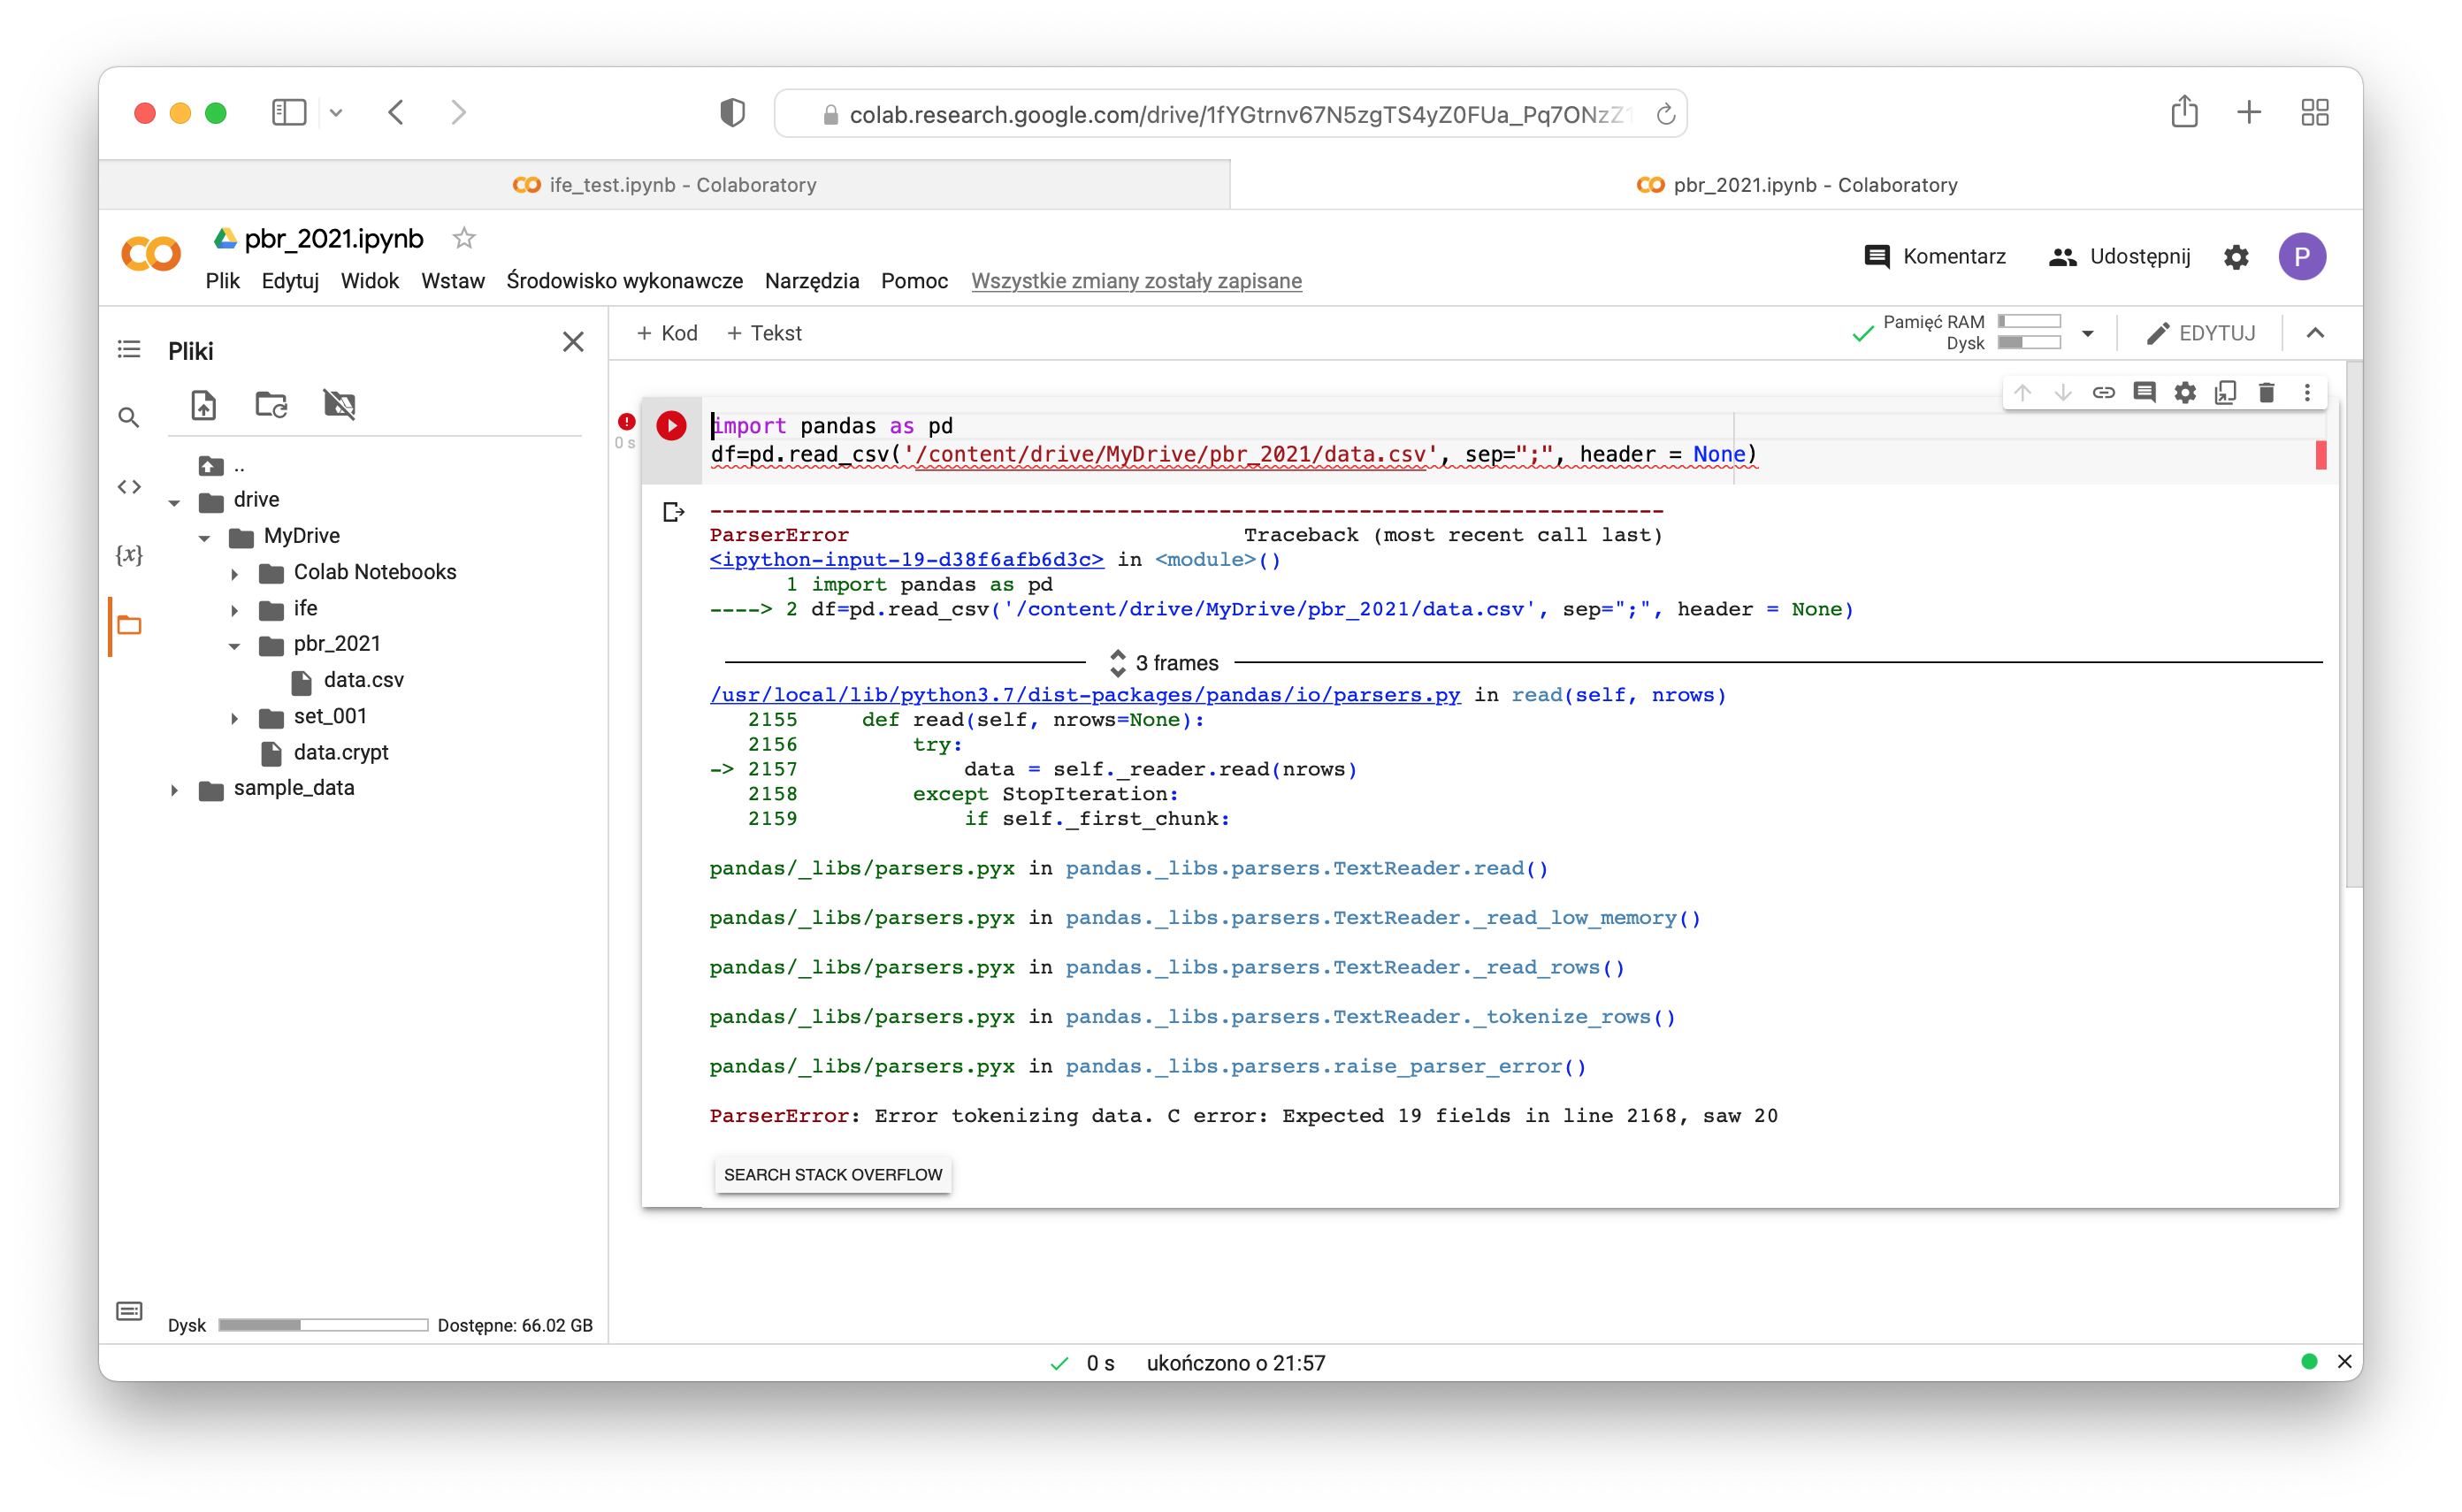
|
Let's check what is wrong in this case.
|
1 2 |
macbook-piotr:talk_with_data fulmanp$ sed -n '2168p' data.csv 3818;132;ToŁosieSuperktosieCzyNie?;02:33:48;00:19:55;00:23:34;00:41:06;00:29:46;00:39:27;1;Navratil Jan;2;Gbur Daniel;3;Szleger Michał;4;Kukucz-Marszalkowska Anna;5;Guja Natalia |
Hmm... this line looks good. I will try to load less data
|
1 2 3 |
import pandas as pd df=pd.read_csv('/content/drive/MyDrive/pbr_2021/data.csv', sep=";", header = None, nrows = 2167) df |

|
As you can see, last loaded row is for team
AssecoBS 4, but when you check this line in terminal, you will see something different:
|
1 2 |
macbook-piotr:talk_with_data fulmanp$ sed -n '2167p' data.csv 3817;3918;Simply the best;02:33:46;00:27:55;00:33:56;00:24:27;00:34:36;00:32:52;1;Wierzbicka Emilia;2;Stojak Małgorzata;3;Bareja Agnieszka;4;Buczak Marta;5;Rumin Anna |
I have no idea, why row number reported in Google Colab is different than line number in csv file. It's strange but you have to find correct line. I will use grep with -n option too find line number of last correctly loaded line:
|
1 2 |
macbook-piotr:talk_with_data fulmanp$ cat data.csv | grep -n 'AssecoBS 4' 2809:659;1677;AssecoBS 4;01:44:07;00:21:09;00:15:54;00:21:54;00:19:09;00:26:01;1;Depta Konrad;2;Domeracki Damian;3;Maj Błażej;4;Skowroński Michał;5;Żeligowska Michalina |
Ok, so you have to check line number 2810:
|
1 2 |
macbook-piotr:talk_with_data fulmanp$ sed -n '2810p' data.csv 660;839;Running is my life ;-);01:44:09;00:19:58;00:19:54;00:20:03;00:21:27;00:22:47;1;Foremski Dawid;2;Michalik Krzysztof;3;Reducha Radosław;4;Klasik-Koscielny Sabina;5;Lincoln Thomas |
And you have the culprit: this time team's name is Running is my life ;-) with ; character inside!
Once again you have to change field separator. This time I will use ^ character.
Anyway, I was curious this line number differences, so I loaded csv with commas into spredsheet and I have found this:

|

|
What?!
The problem starts in row number 418:
|
1 |
1918;5211;"Znakomicie, wszyscy!”;01:59:50;00:25:11;00:24:55;00:25:02;00:19:09;00:25:33;1;Ewa Czaja;2;Ewa Lipka;3;Parkita Justyna;4;Maciej Stachura;5;Michał Mendala |
and ends in row number 1060:
|
1 |
3660;2102;INGowe "pędziwiatry";02:27:43;00:22:04;00:46:01;00:25:25;00:23:32;00:30:41;1;Szymonowicz Nikola;2;Fabian Angelika;3;Erdmański Igor;4;Kowolik Adrianna;5;Juszczyk Bartosz |
Making fast computations:
|
1 2 |
2810 - 2167 = 643 1060 - 418 = 642 |
If you look carefully into team's name in row 418: "Znakomicie, wszyscy!” you will see that two different chars are used to delimit string: opening is " while closing is ”, so this is why all next rows till row number 1060 is treated as one long string.
To fix this, you have to manually replace ” with " to the form:
|
1 |
1918^5211^"Znakomicie, wszyscy!"^01:59:50^00:25:11^00:24:55^00:25:02^00:19:09^00:25:33^1^Ewa Czaja^2^Ewa Lipka^3^Parkita Justyna^4^Maciej Stachura^5^Michał Mendala |
Now you can upload fixed file to Google drive and check if it loads:
|
1 2 3 |
import pandas as pd df=pd.read_csv('/content/drive/MyDrive/pbr_2021/data.csv', sep="^", header = None) df |

|
Hooray! 4663 rows are loaded successfully which agrees with total number of rows in this file:
|
1 2 |
macbook-piotr:talk_with_data fulmanp$ wc data.csv 4663 36473 812208 data.csv |
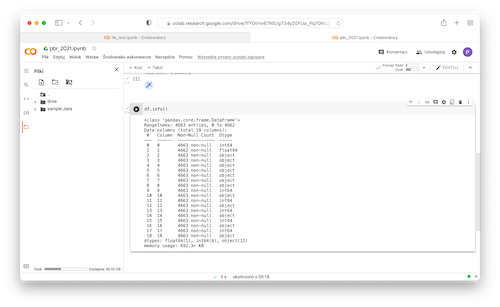
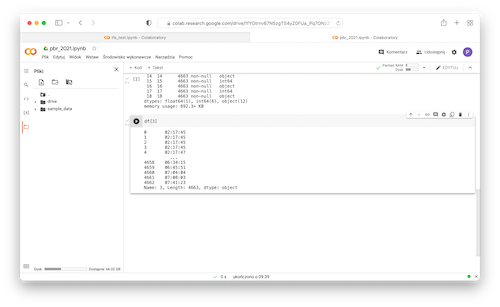
- Display some informations about data types used to represent the data:
1df.info()
- Extract column at index 3 which is a column with total teams' time:
1df[3]
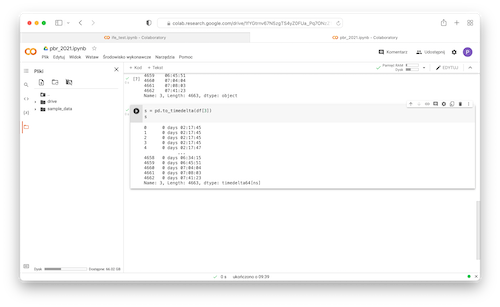
- Convert data to
timedeltatype to be able to perform time calculations:
12s = pd.to_timedelta(df[3])s
- Convert timedelta to number of seconds:
12ts = s.dt.total_seconds()ts

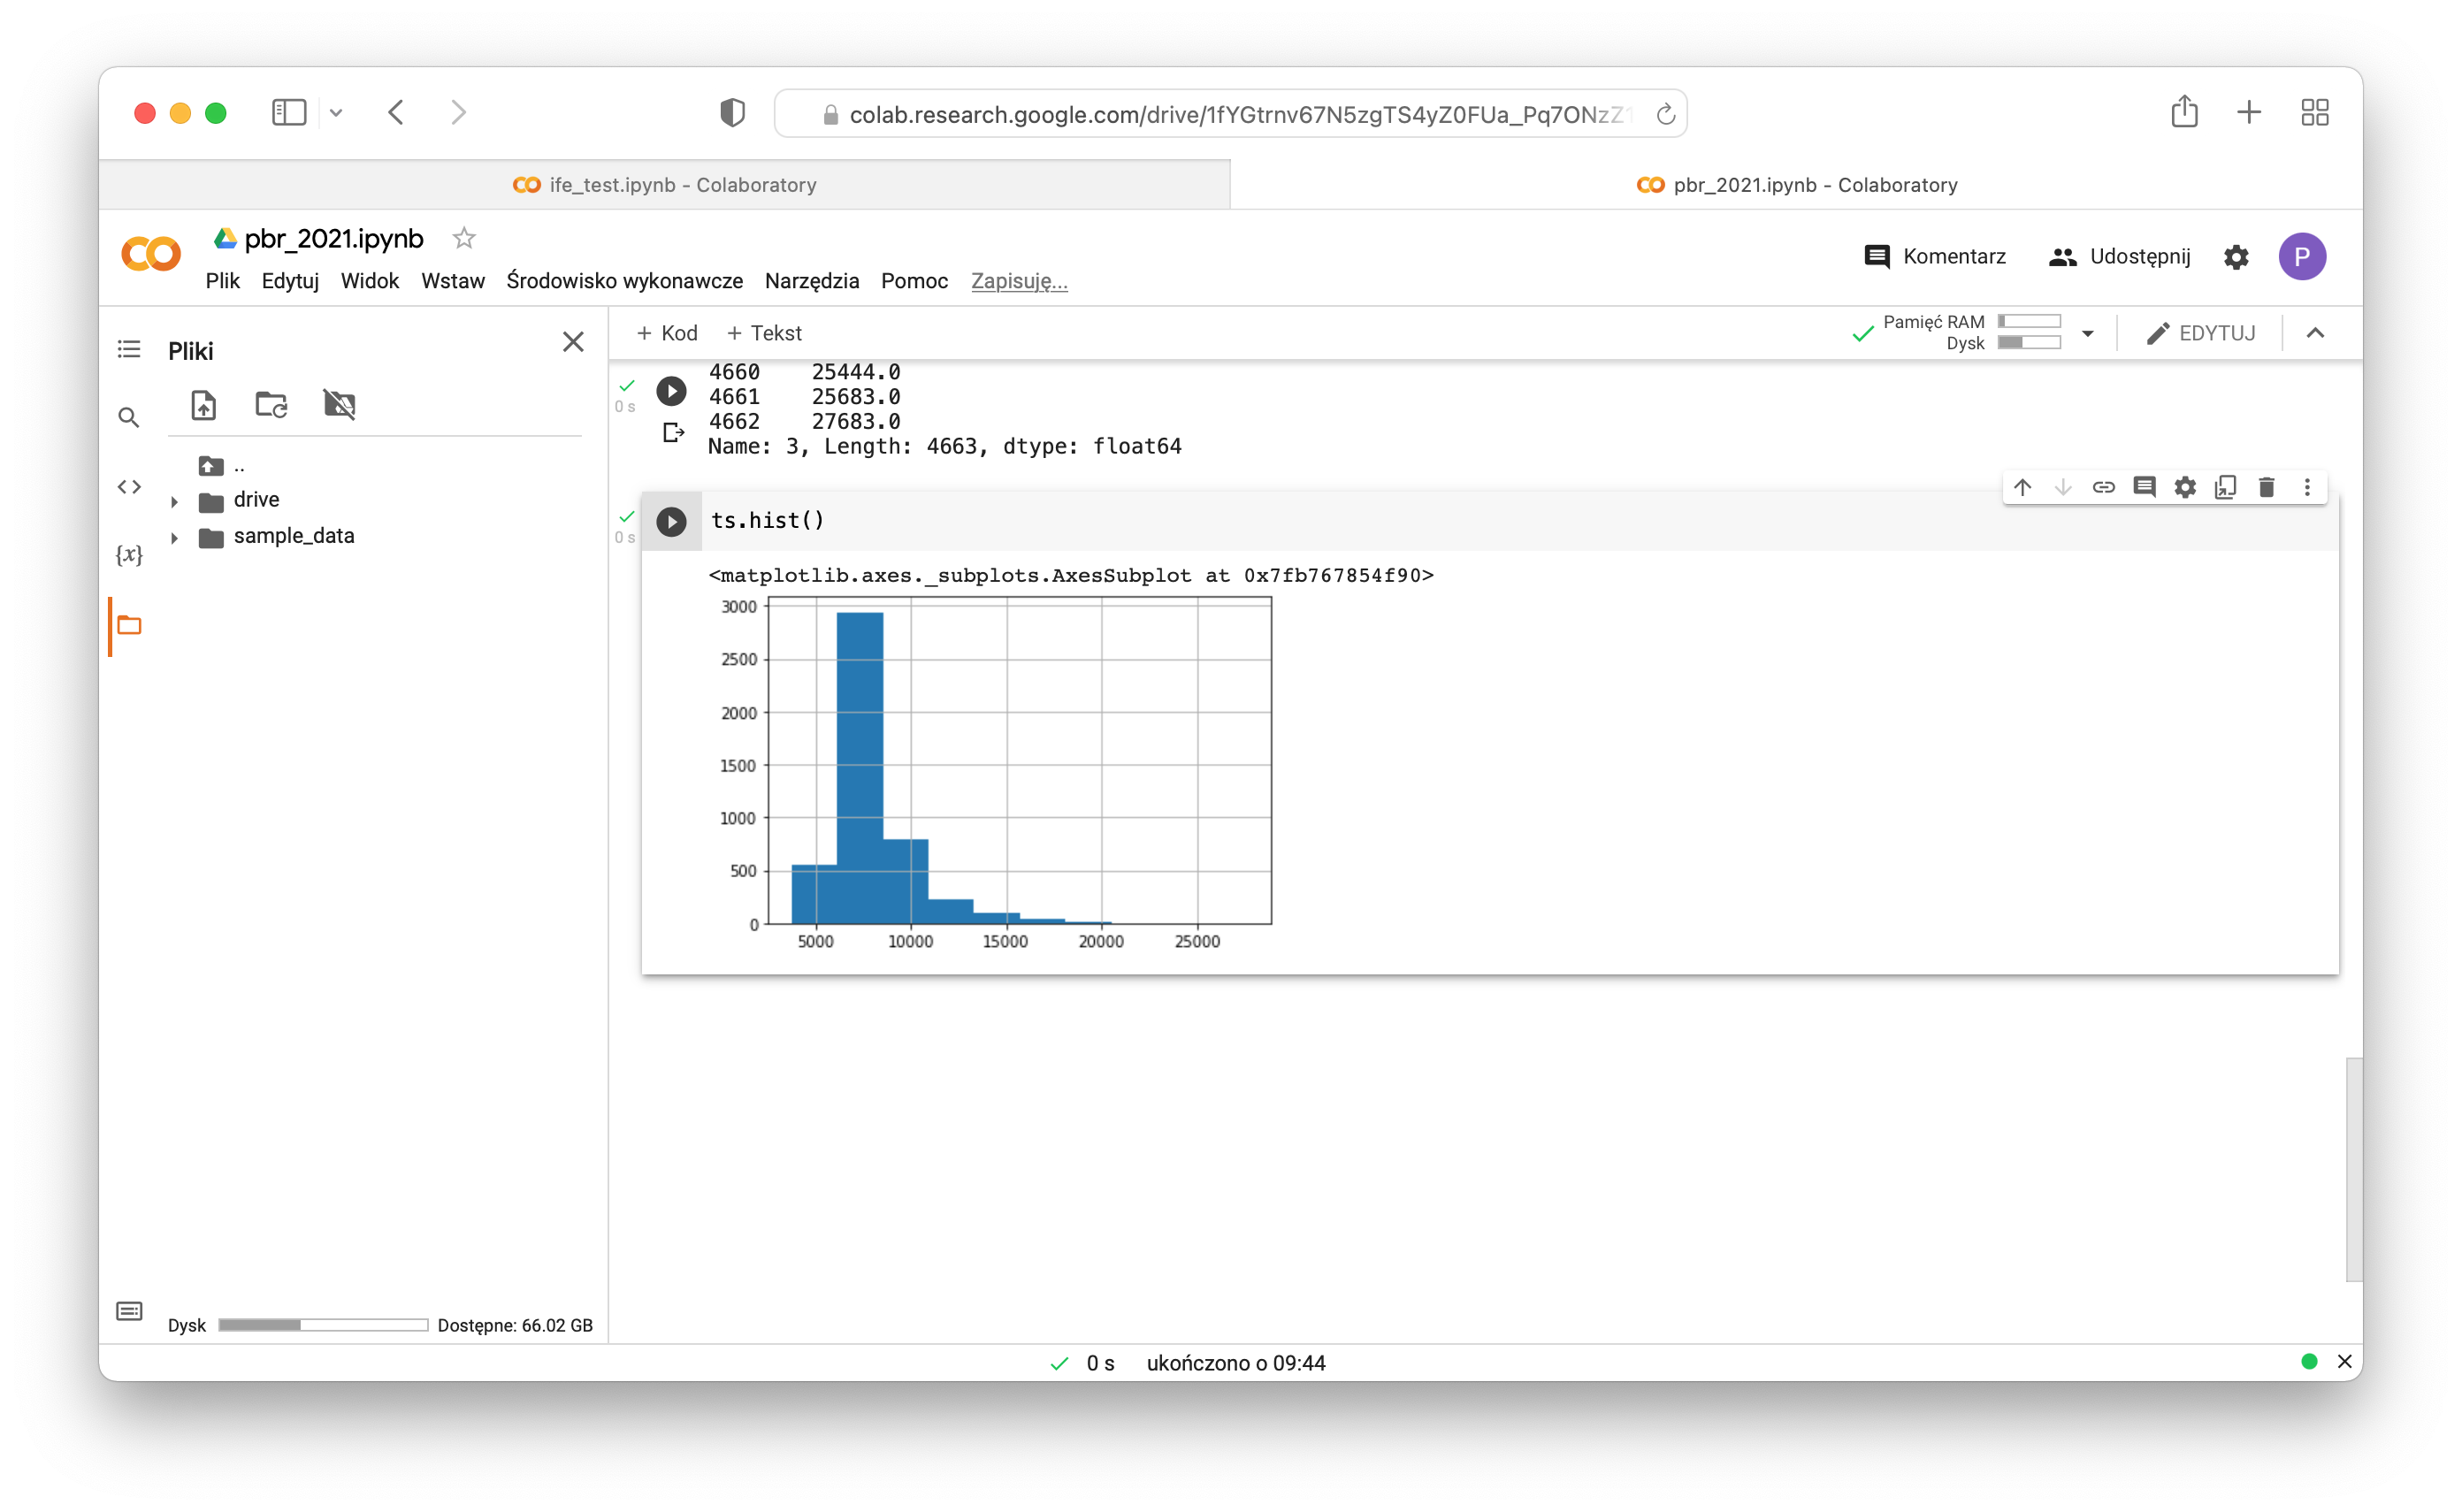
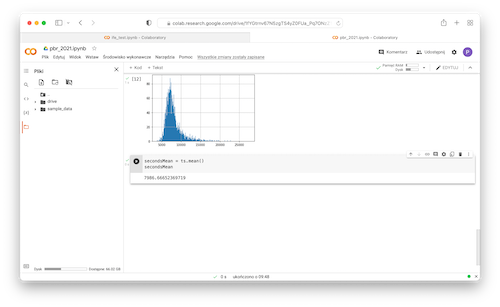
- Do some simple histograms:
1ts.hist()

1ts.hist(bins=50)

1ts.hist(bins=500)

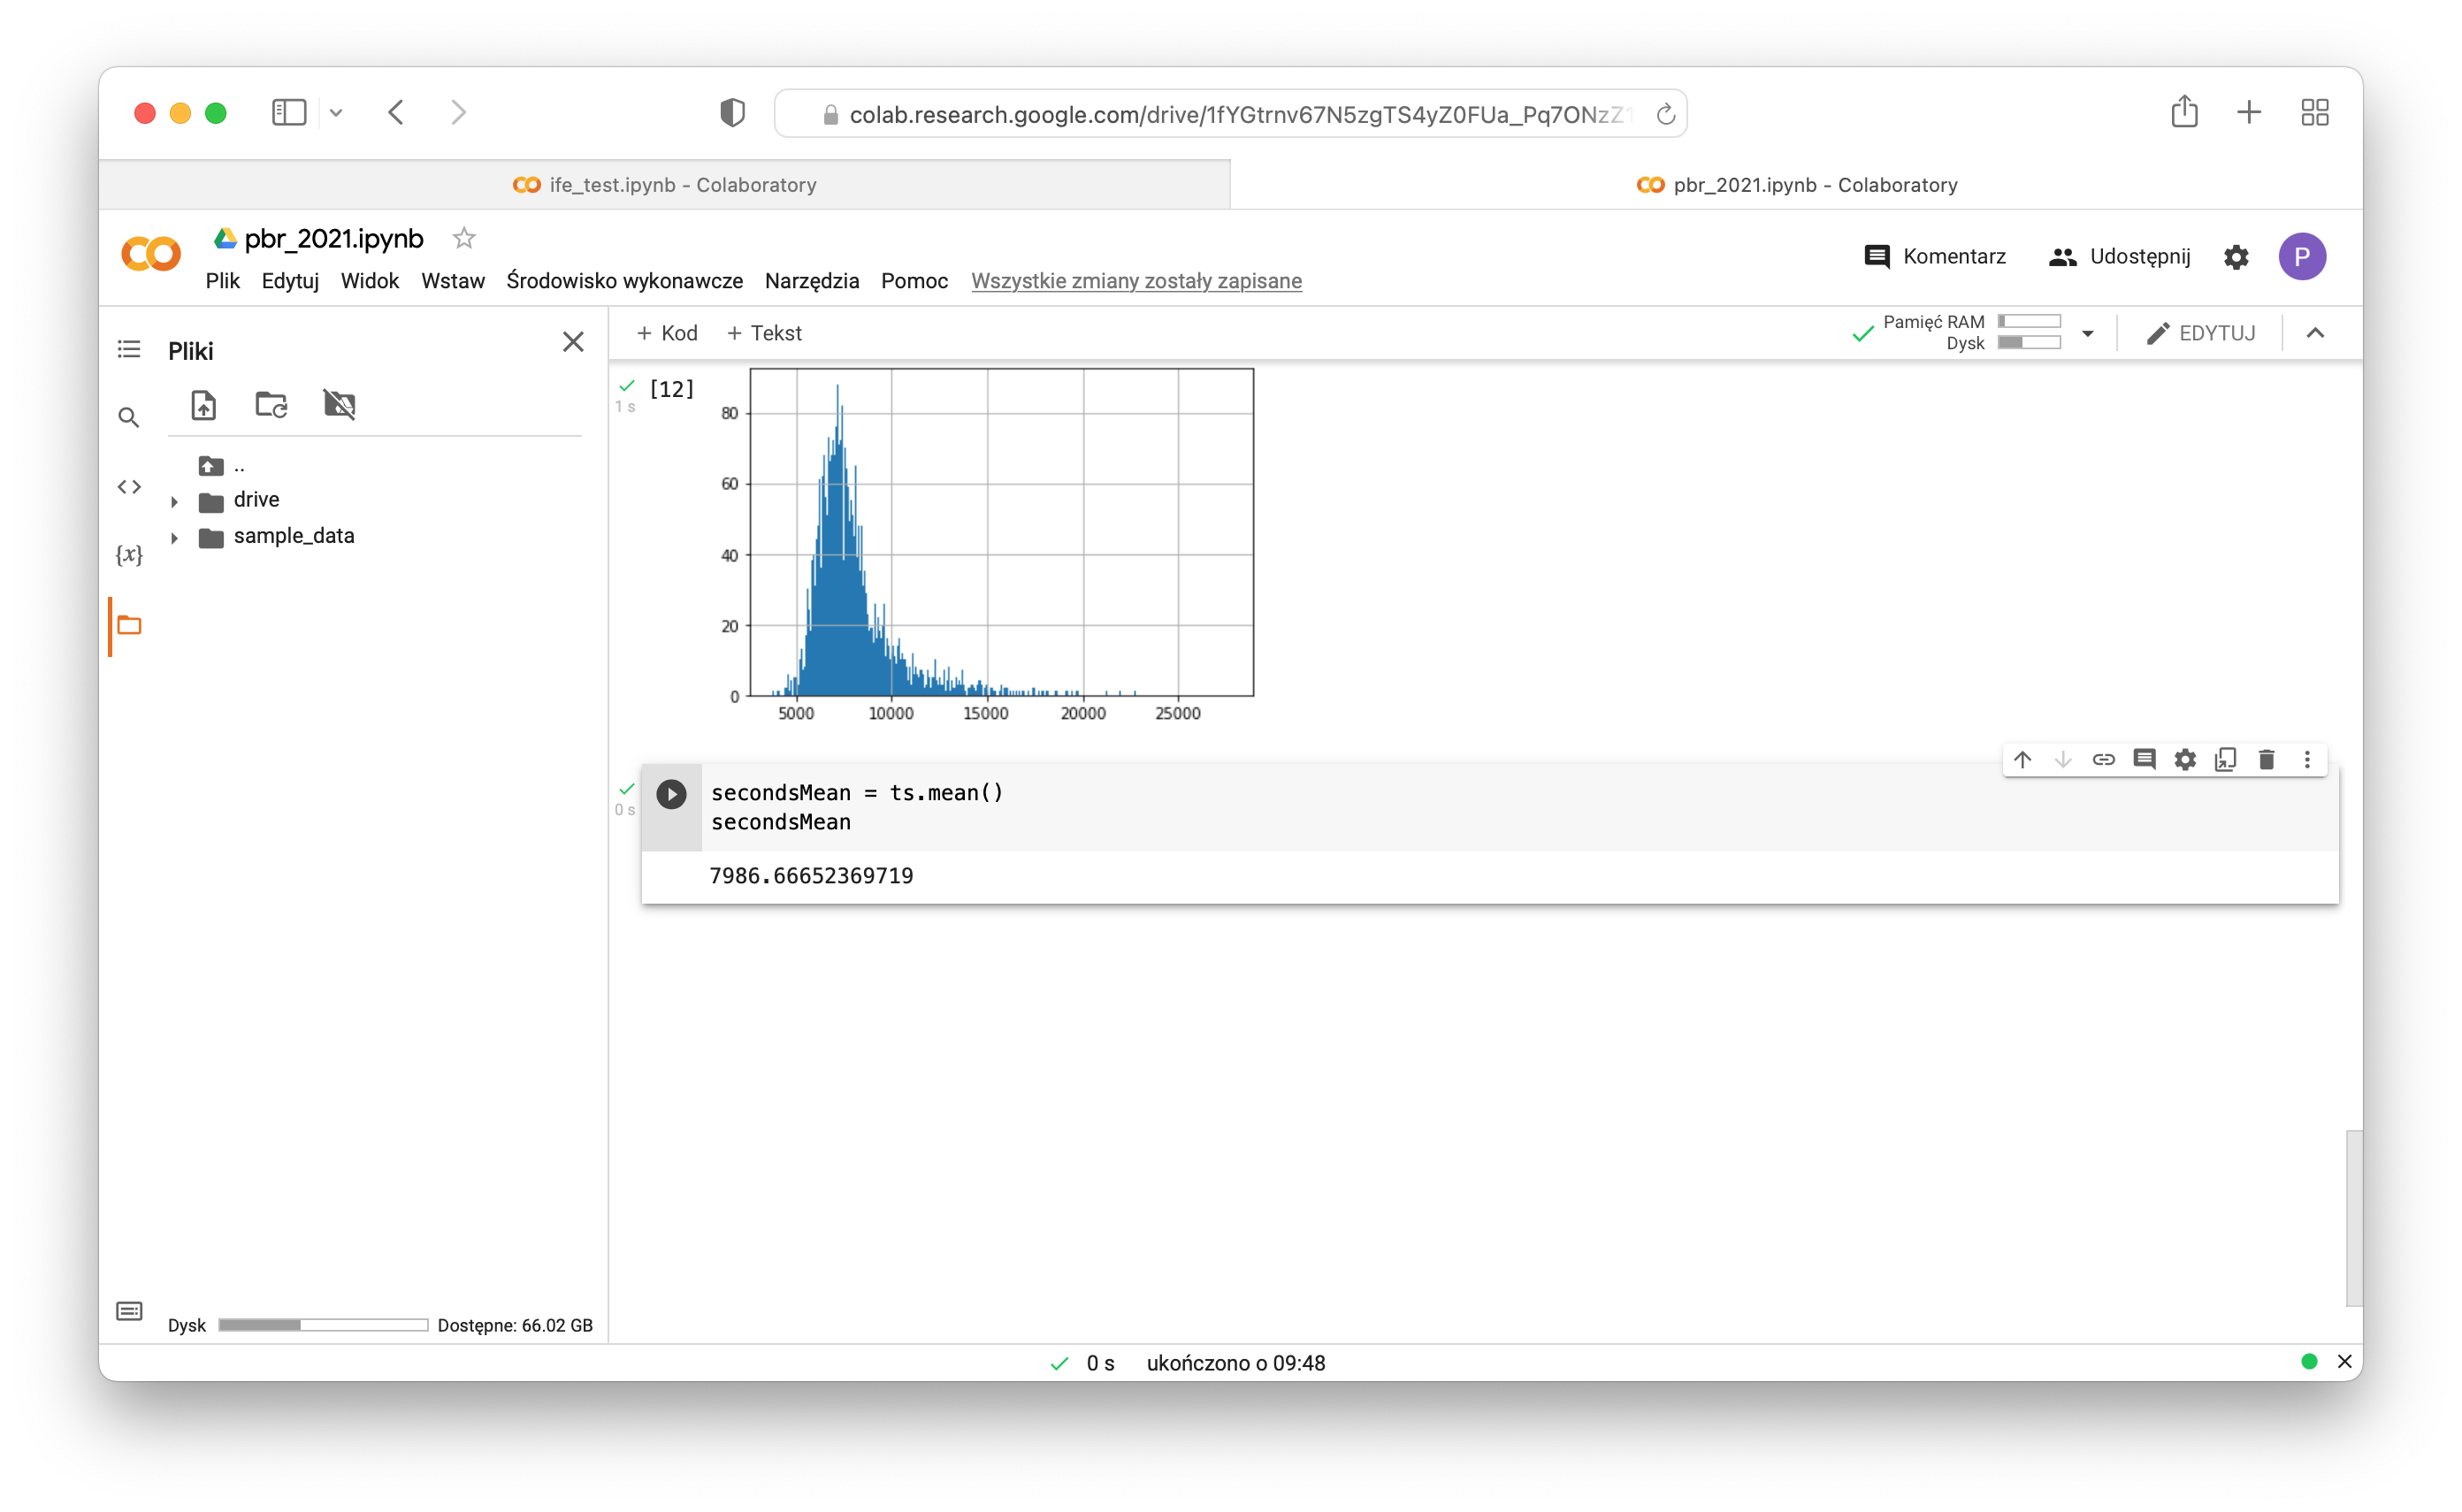
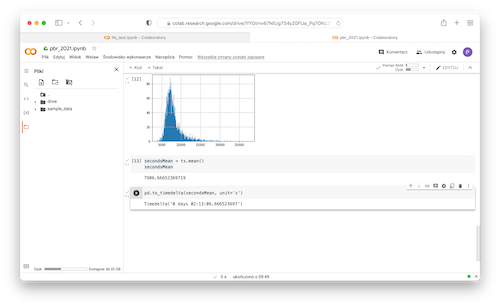
- Calculate mean:
12secondsMean = ts.mean()secondsMean
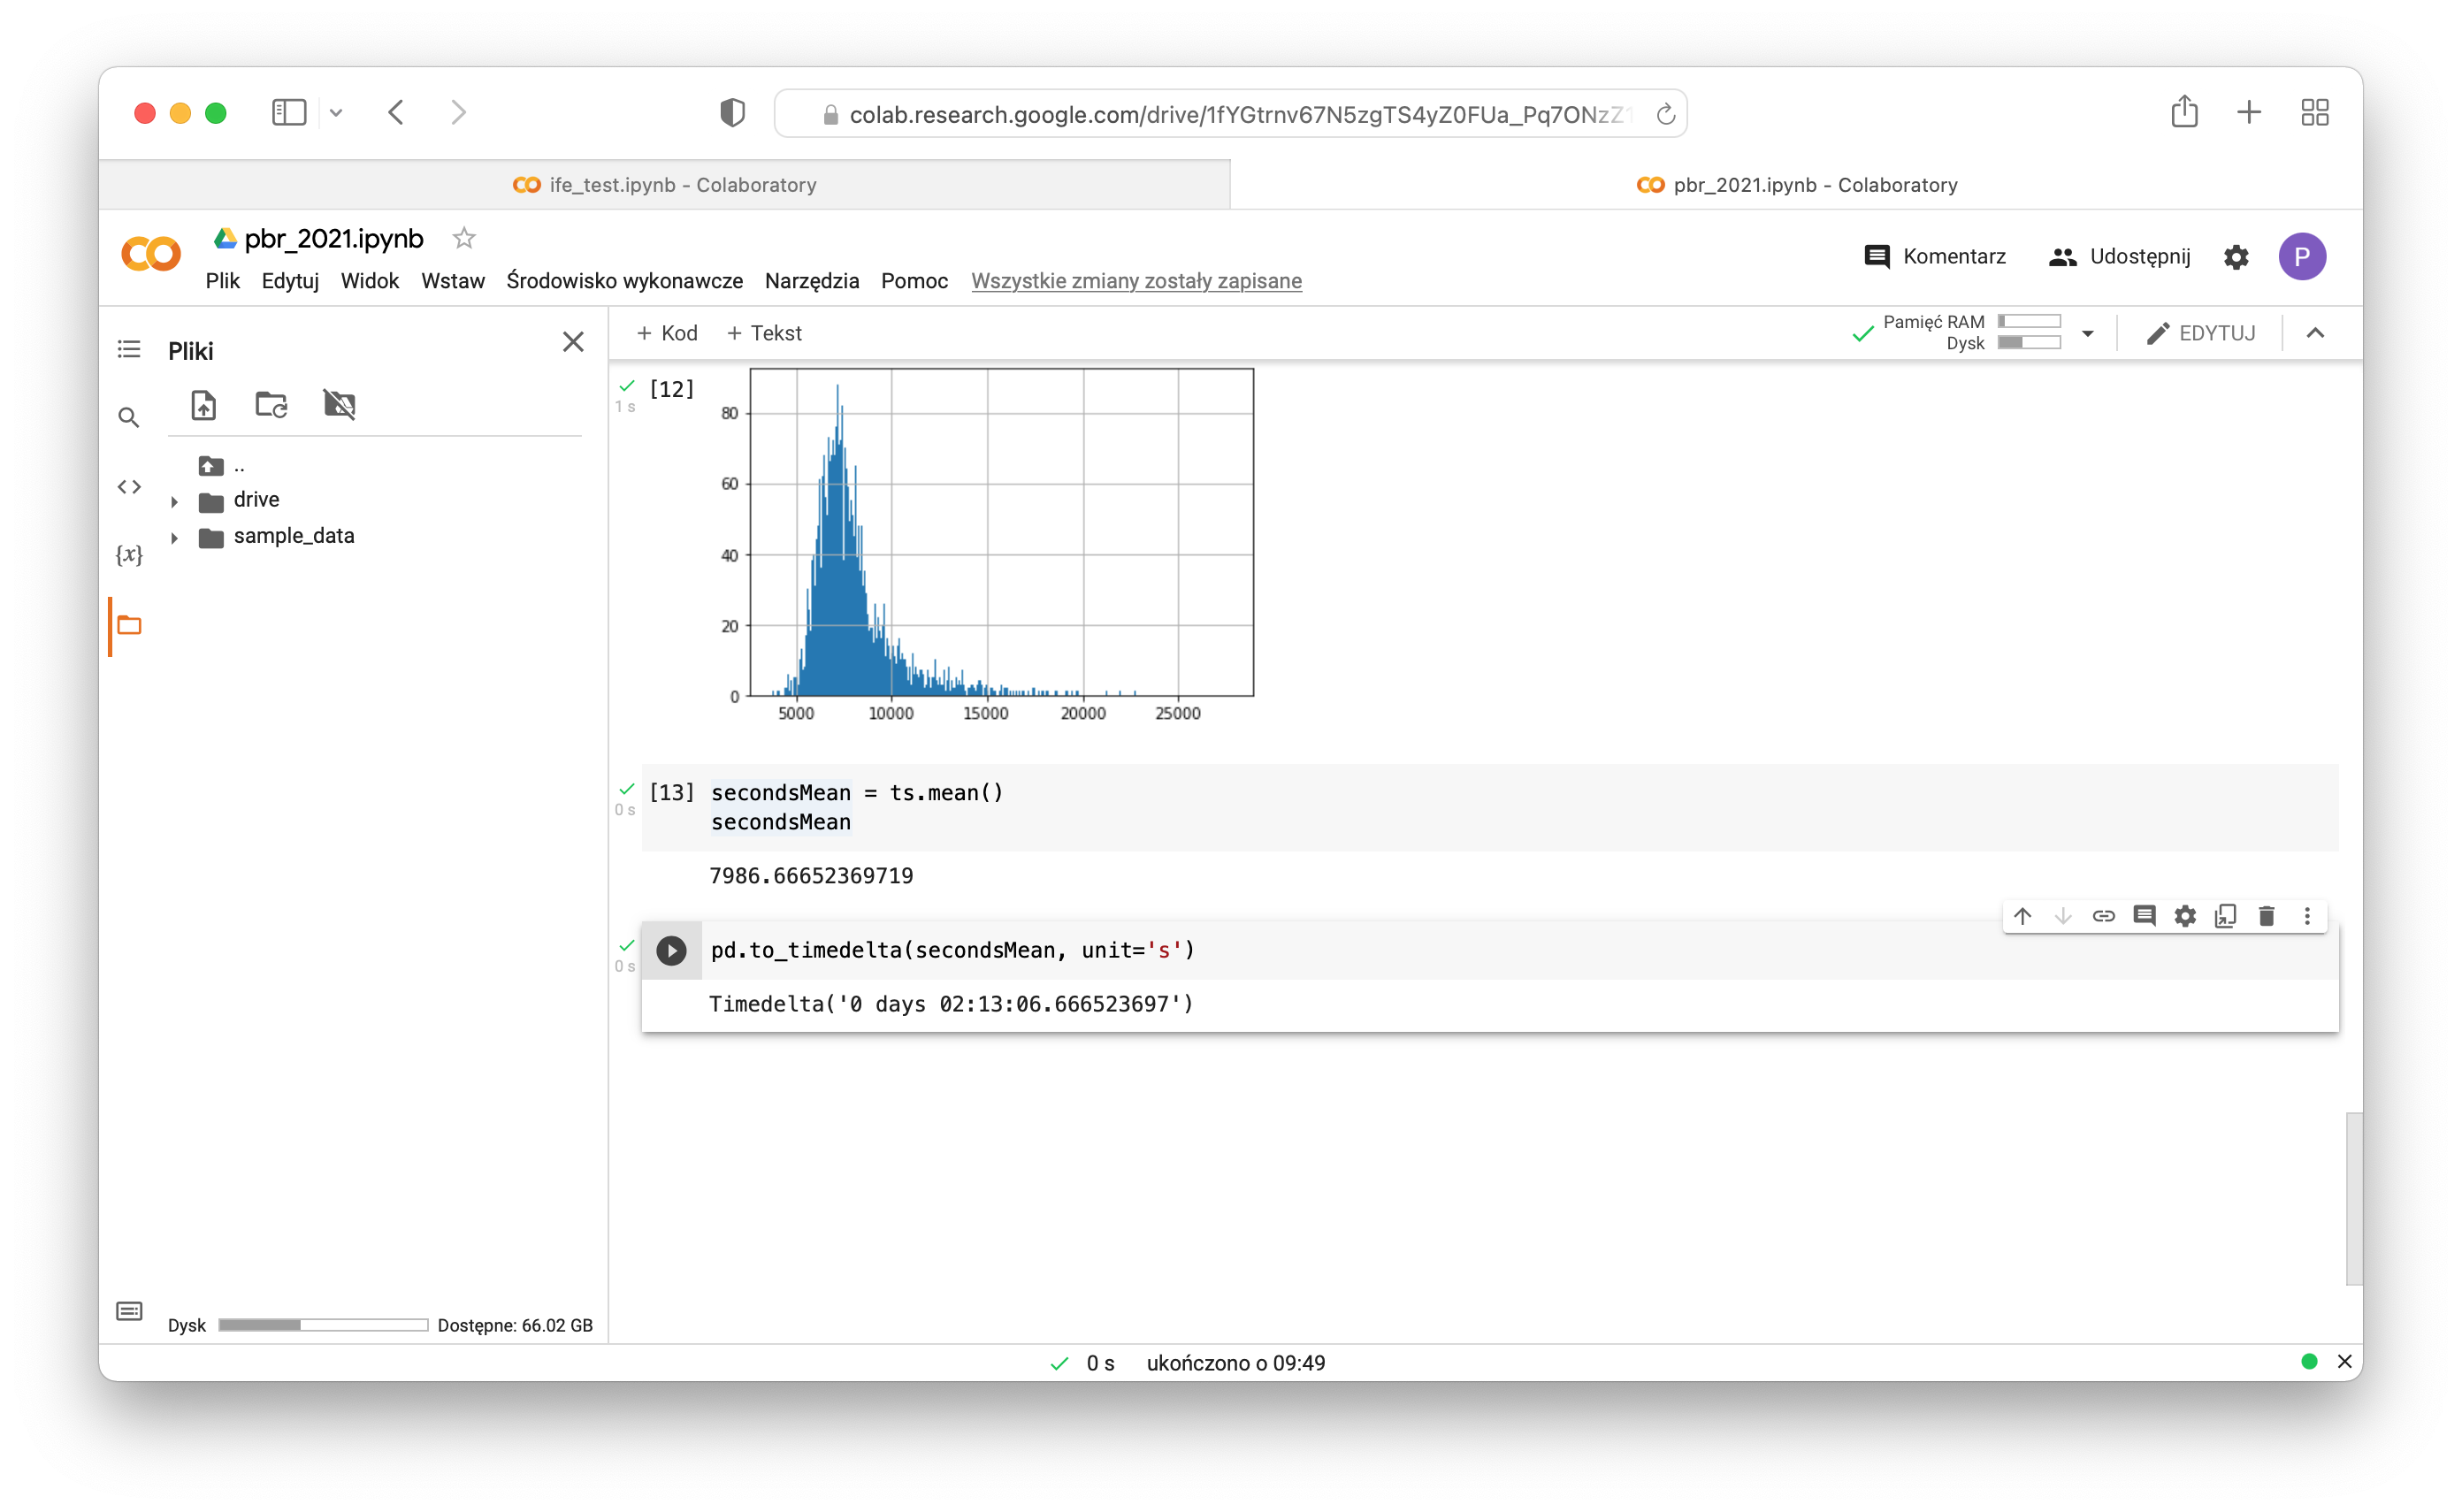
- Convert seconds to time delta:
1pd.to_timedelta(secondsMean, unit='s')
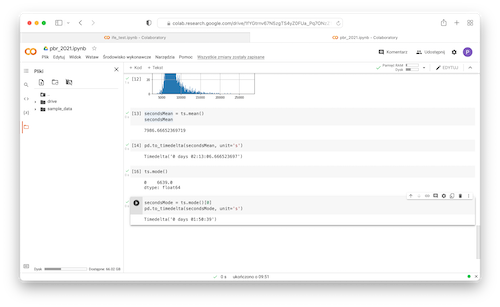
- Calculate mode:
1ts.mode()
12secondsMode = ts.mode()[0]pd.to_timedelta(secondsMode, unit='s')